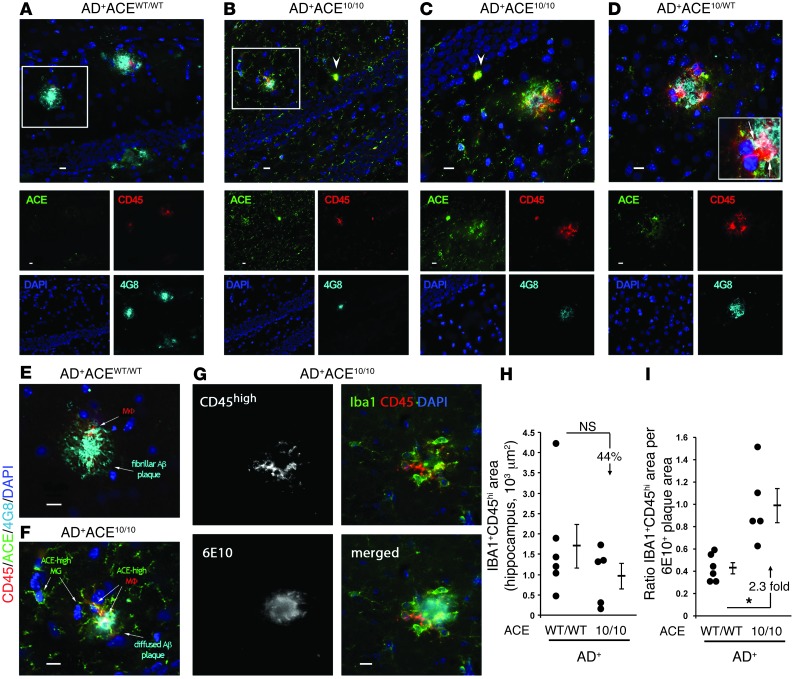
Figure 6. Infiltrating monocytic cells are increasingly associated with Aβ plaque and cellular uptake of Aβ.
(A–F) Fluorescent micrographs of hippocampal and cortical plaques from 7-month-old mice. Sections were immunolabeled for ACE (green), CD45 (red), human Aβ (4G8; cyan), and nuclei (DAPI; blue). A–D show the composite picture and images from the individual color channels. (A) In AD+ACEWT/WT brains, the plaques were generally larger and composed of highly aggregated Aβ. CD45hiACElo cells were colocalized with amyloid plaques. (B and C) In AD+ACE10/10 mice, the plaques were generally smaller and had a more diffuse morphology. CD45hiACEhi infiltrating monocyte–derived macrophages were more frequently present in the vicinity of amyloid plaques. ACE was also expressed in the brain by resident CD45lo-intermedACEhi microglia. In AD+ACE10/10 mice, infiltrating monocytes expressed high levels of ACE (arrowheads). (D) Cortical region from an AD+ACE10/WT mouse showed increased CD45hiACEhi infiltrating macrophages at the amyloid lesion site. Colocalization of CD45hiACEhi cells and intracellular Aβ immunoreactivity (arrows in insert) were observed, indicating cellular uptake of Aβ. (E and F) Enlargements of boxed areas in A and B. (F) In the AD+ACE10/10 plaque region, macrophages (MΦ) and microglia (MG) overexpressed ACE. Internalization of Aβ (white) by plaque-associated CD45hiACEhi macrophages was observed. (G) Multichannel image shows recruitment of blood-derived IBA1+ (green) CD45hi (red) macrophages to 6E10+ plaque (cyan) in AD+ACE10/10 brain. Scale bars: 10 μm. (H) Quantitation of IBA1+CD45hi immunoreactive area. (I) The ratio of IBA1+CD45hi area to the 6E10-immunoreactive area showed a significant increase (2.3-fold) in the number of macrophages per plaque area in AD+ACE10/10 versus that observed in AD+ACEWT/WT mice. *P < 0.05.

