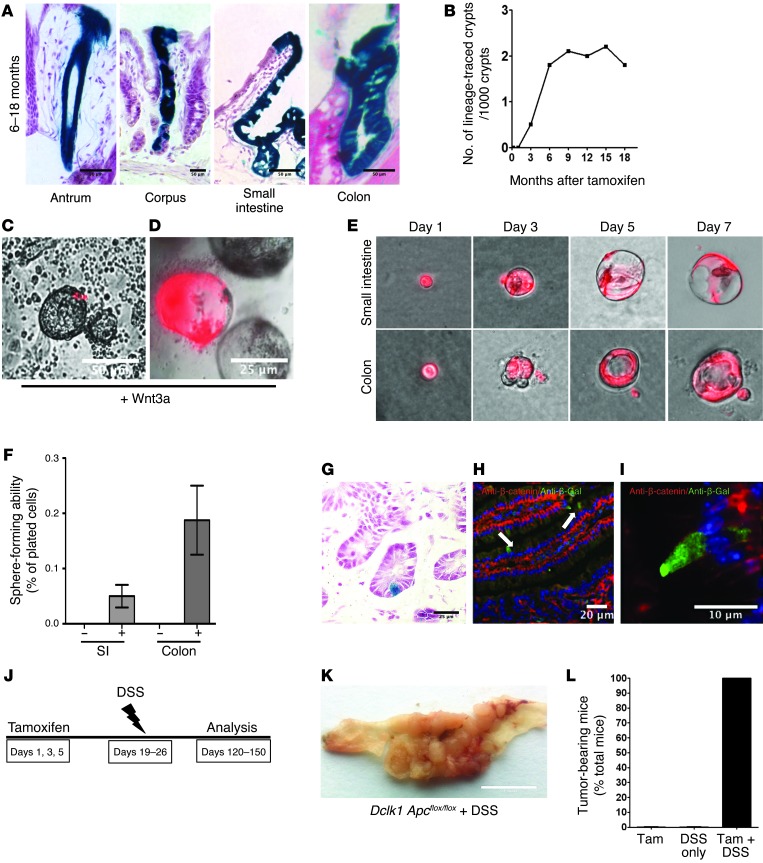
Figure 4. Quiescent DCLK1+ cells serve as colon cancer–initiating cells.
(A) LacZ staining of Dclk1 R26LacZ mice showing traced crypts in the stomach, small intestine, and colon. Scale bars: 50 μm. (B) Quantification of traced crypts in Dclk1 R26LacZ mice. (C and D) Intestinal organoids derived from Dclk1 R26tdTom mice in the presence of Wnt3a at baseline (C) and after 2 weeks (D) in culture. Scale bars: 50 μm (C) and 25 μm (D). (E) DCLK1+ cells from the small intestine (upper panels) and colon (lower panels) of Dclk1 R26tdTom mice were sorted based on red fluorescent protein (RFP) expression (see also Supplemental Figure 1) and cultured in vitro for 7 days in the presence and absence of Wnt3a. Original magnification, x100. (F) Quantification of organoid formation in the presence and absence of Wnt3a (n = 3). (G) LacZ staining of the colon of a Dclk1 R26LacZ Apcflox/flox mouse 14 months after tamoxifen treatment. Scale bar: 25 μm. (H and I) IHC for β-gal (green) and β-catenin (red) in Dclk1 R26LacZ Apcflox/flox mice after tamoxifen treatment. (I) Representative image of a single recombined DCLK1+ cell without nuclear translocation of β-catenin. Scale bars: 20 μm (H) and 10 μm (I). (J) Experimental setup for DSS treatment in Dclk1 R26LacZ Apcflox/flox mice. (K) Gross pathology of resulting tumors in Dclk1 R26LacZ Apcflox/flox mice. Scale bar: 0.5 inches. (L) Quantification of tumor incidence in Dclk1 R26LacZ Apcflox/flox mice after treatment with tamoxifen, DSS only, and tamoxifen plus DSS (n ≥5 mice/group).

