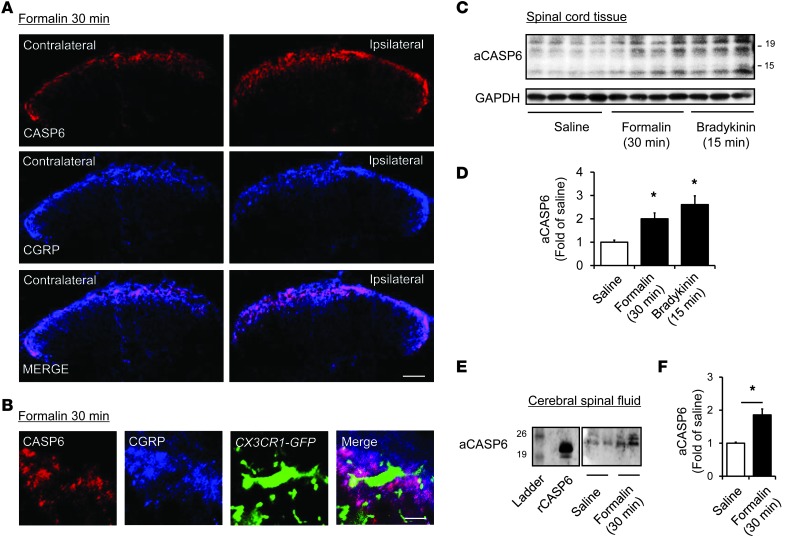
Figure 2. Upregulation of CASP6 in the spinal cord and CSF after acute inflammation.
(A) Double staining of CASP6 and CGRP in the ipsilateral and contralateral dorsal horn 30 minutes after formalin injection. Scale bar: 100 μm. (B) Triple staining of CASP6, CGRP, and CX3CR1 (GFP) in the ipsilateral dorsal horn 30 minutes after formalin injection. Note close contacts between CASP/CGRP-expressing axonal terminals and microglial cell body and processes. Scale bar: 10 μm. (C and D) Western blot analysis showing the bands of active CASP6 (aCASP6, ≈20 and 10 kDa) 30 minutes after the formalin (5%) injection and 15 minutes after bradykinin (300 ng) injection. (D) Intensity of aCASP6 bands. *P < 0.05, n = 3–4 mice. (E and F) Western blotting analysis showing increase of aCASP6 in the CSF. The positive control band of rCASP6 is indicated. (F) Intensity of aCASP6 bands. *P < 0.05, n = 5 rats.

