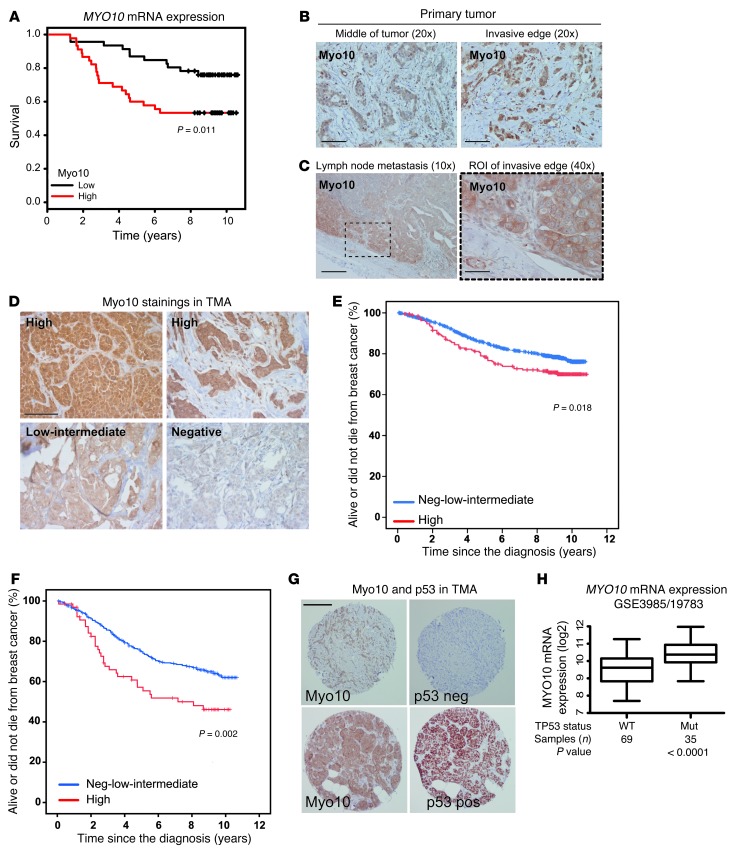
Figure 5. High Myo10 expression in clinical breast cancer samples.
(A) MYO10 expression and survival (Kaplan-Meier curves) were analyzed in 104 patients with early breast cancer (GEO GSE3985/GSE19783 series; ref. 4). log-rank test P value, P = 0.011. (B) Myo10 protein immunostaining from the middle and at the invasive edges of the primary breast carcinomas. Scale bar: 200 μm. (C) Expression of Myo10 in a lymph node metastasis from the primary tumor shown in B. Scale bar: 100 μm (original magnification, ×10); 400 μm (original magnification, ×40). (D) Examples of immunostaining, and scoring of different Myo10 expression levels in TMA samples. Scale bar: 100 μm. (E) Survival of 1,326 Finnish patients with early breast cancer and high Myo10 expression (red) or low-intermediate/negative Myo10 expression (blue). log-rank test, P = 0.018. (F) Survival of the subset of 482 patients with regional lymph node–positive breast cancer (pN+) as in E. (G) Comparison of tumor Myo10 and p53 staining from adjacent TMA slices from a tumor with negative and positive Myo10 and p53 expression. Scale bar: 200 μm. (H) Analysis of MYO10 mRNA expression (log2 scale, P value, Student’s t test) and p53 mutations in breast cancer (n = 109; GEO GSE3985/GSE19783 series; ref. 4).

