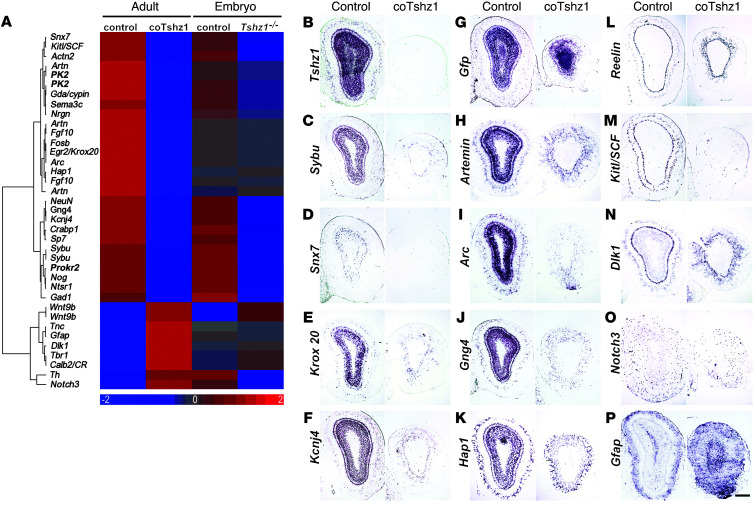
Figure 8. Microarray and mRNA expression analyses of OBs of embryonic and postnatal Tshz1 mutant mice.
(A) Cluster analysis of expression of selected genes (red, high expression; blue, low expression; log2 scale). (B–P) Coronal sections were analyzed by in situ hybridization using probes against Tshz1 (B), Gfp (G), and Reelin (L) as well as those against a subset of differentially expressed mRNAs from the microarray screen, as indicated. Expression of these transcripts in coTshz1 mutants was (i) reduced in the granule cell layer and granule cells of the mitral cell layer (Sybu, C; Snx7, D; Krox20, E; Kcnj4, F; Artemin, H; Arc, I; Gng4, J; Hap1, K); (ii) reduced in the mitral cells and superficial tufted cells (Kitl/SCF, M); (iii) maintained in mitral cells (Dlk1, N) or in scattered cells of the OB (Notch3, O); or (iv) broadly increased throughout the OB (Gfap, P). Note that expression of the mitral cell layer marker Reelin (L) was retained in coTshz1 mutants, although some disorganization of the mitral cell layer was apparent. Scale bar: 300 μm.

