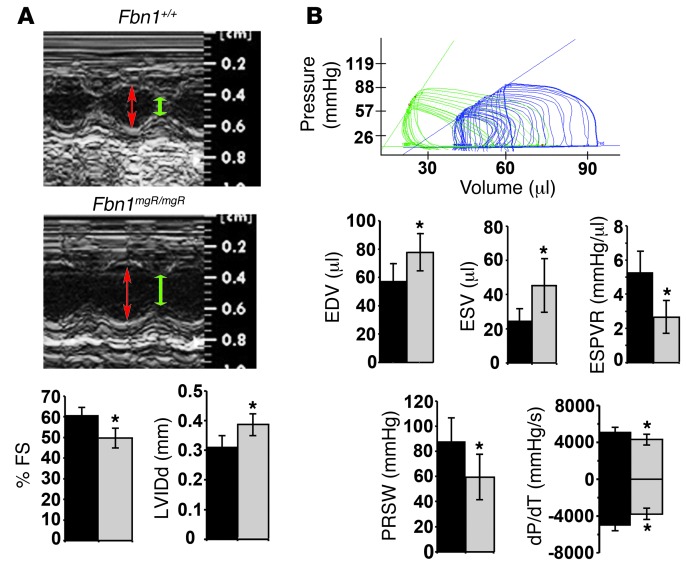
Figure 1. DCM detection in MFS mice.
(A) Top: representative echo M-mode images taken at the level of the mid-papillary muscle from 3-month-old Fbn1+/+ and Fbn1mgR/mgR mice; red and green double-headed arrows highlight LV internal diameter in diastole (LVIDd) and systole (LVIDs), respectively. Percentage of fractional shortening (FS) was calculated as (LVIDd – LVIDs) / LVIDd × 100. Bottom: Bar graphs summarize the LVIDd and percentage of FS data in Fbn1+/+ and Fbn1mgR/mgR mice (n >15 per genotype). (B) Representative in vivo PV loop tracings in Fbn1mgR/mgR (blue) compared with Fbn1+/+ (green) mice. PV loop quantification of cardiac function including EDV, ESV, ESPVR, PRSW, and dP/dT maximum and minimum values (n = 5 per genotype). *P < 0.05; bars indicate the mean ± SD.

