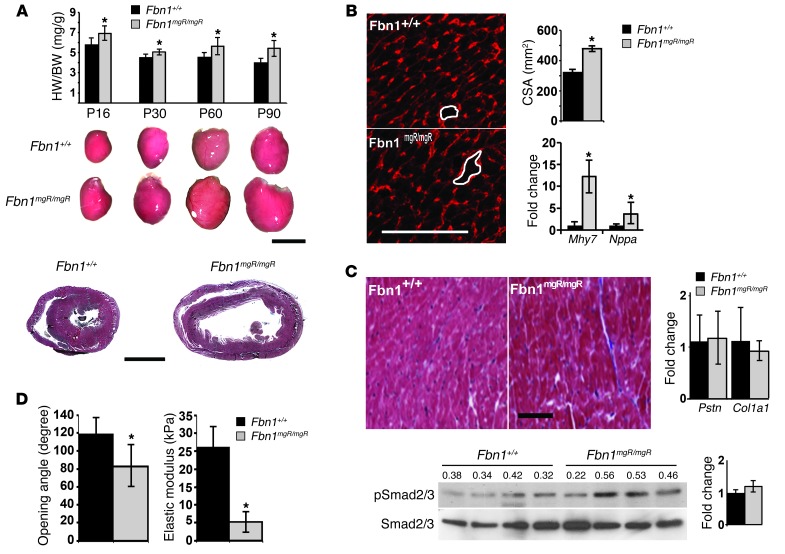
Figure 2. DCM characterization in MFS mice.
(A) Representative Fbn1+/+ and Fbn1mgR/mgR hearts collected at the indicated stages of postnatal life with the respective ventricular HW/BW estimates shown by the bar graphs above them (n > 5 per genotype and time point). Scale bar: 5 mm. H&E staining of representative heart sections from 3-month-old Fbn1+/+ and Fbn1mgR/mgR mice are shown below. Scale bar: 1 mm. (B) Representative WGA-stained cross sections of Fbn1+/+ and Fbn1mgR/mgR hearts (white tracings highlight myocyte cross-sectional area [CSA]), with overall estimates of cardiac hypertrophy expressed as CSA. Levels of hypertrophy-related transcripts β-myosin heavy chain (Mhy7) and natriuretic peptide A (Nppa) are shown on the right. Scale bar: 100 μm. (C) Representative trichrome-stained cross sections of Fbn1+/+ and Fbn1mgR/mgR hearts (left) shown together with quantitative PCR estimates of fibrogenic transcripts periostin (Pstn) and collagen I (Col1) (right), and Smad3 immunoblots of total protein extracts (bottom) from 3-month-old Fbn1+/+ and Fbn1mgR/mgR myocardium. Scale bar: 100 μm. (D) Mean opening angle (degree) of the LV free wall (left) and elastic modulus (kPa) measurement (right) in the myocardium of 2-month-old Fbn1+/+ and Fbn1mgR/mgR hearts (n = 5 per genotype and assay). *P < 0.05; bars indicate the mean ± SD.

