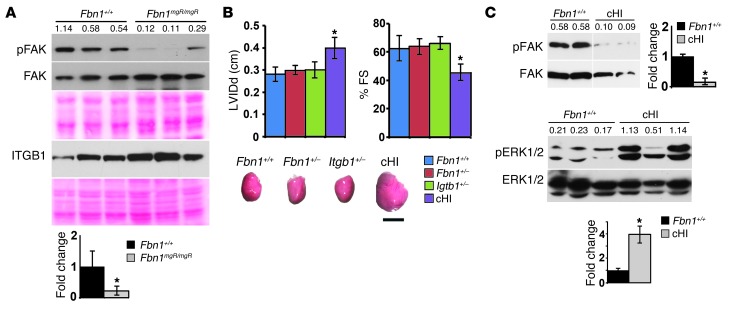
Figure 5. Integrin involvement in MFS-related DCM.
(A) Illustrative immunoblots of pFAK and FAK proteins and β1 integrin in myocardial extracts from 3-month-old Fbn1+/+ and Fbn1mgR/mgR mice. Ponceau staining is shown below each immunoblot as an indication of total protein loading. (B) Cardiac function in 3-month-old mice of the indicated genotypes (cHI denotes compound haploinsufficient Fbn1+/–;Itgb1+/– mice), with the representative hearts shown below the assays. *P < 0.05 relative to Fbn1+/+ samples (n = 5 per genotype), and mean ± SD. ANOVA P < 0.05. Scale bar: 5 mm. (C) Illustrative immunoblots of FAK and ERK1/2 proteins in myocardial extracts from 3-month-old Fbn1+/+ and cHI mice (n = 5). In A and C, numbers above each lane indicate ratios between phosphorylated and nonphosphorylated proteins. FAK immunoblot in C includes lanes that were run on the same gel but were not contiguous.

