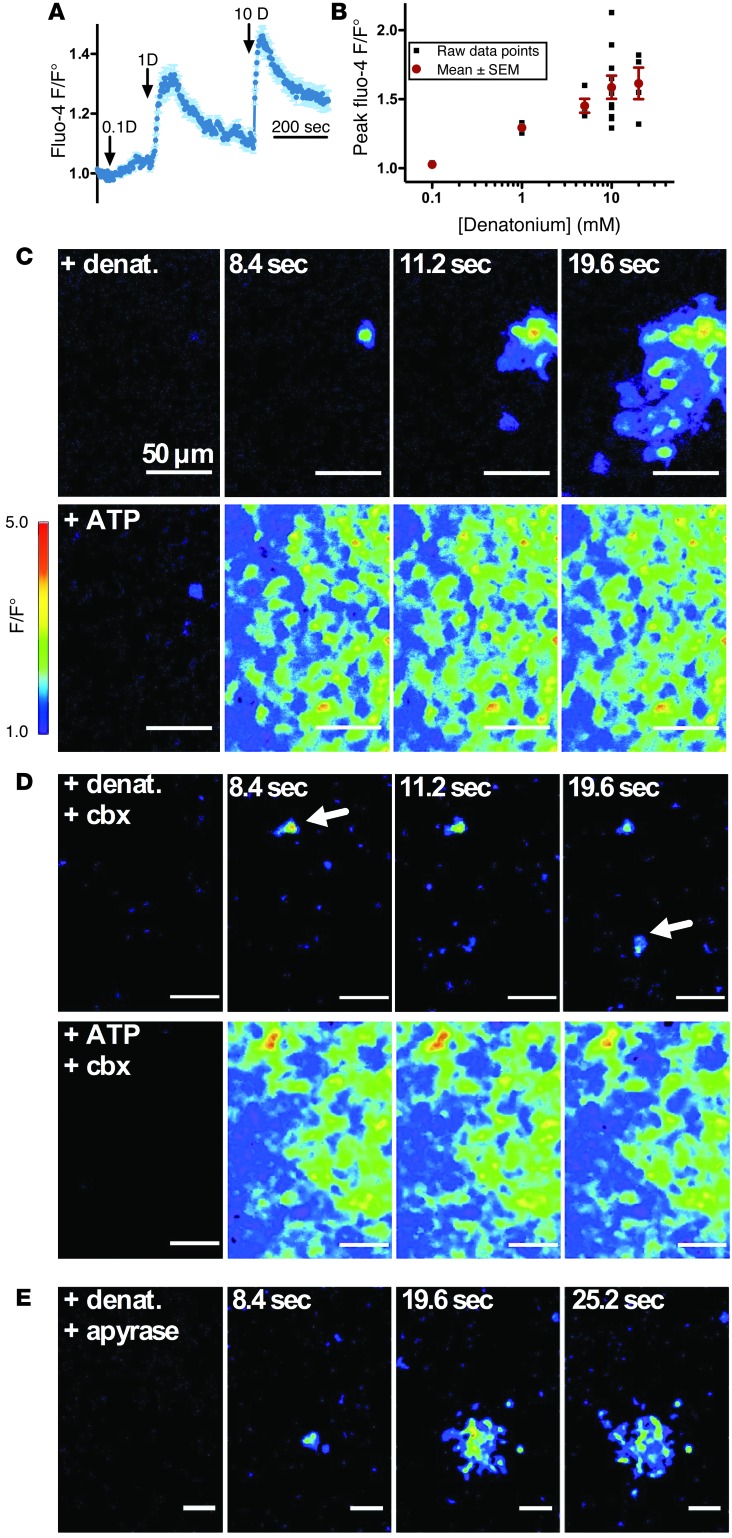
Figure 1. Calcium responses in sinonasal ALIs during stimulation with denatonium benzoate.
(A) Representative trace showing dose-dependent calcium elevations in response to denatonium. 0.1 D, 0.1 mM denatonium benzoate; 1 D, 1 mM denatonium benzoate; 10 D, 10 mM denatonium benzoate. (B) Dose response plot of data from experiments shown in A. Each red data point is the mean of results from 5 to 12 experiments. (C) Representative images showing propagation of calcium signal from single denatonium-responding cells compared to global calcium mobilization by ATP. denat., denatonium. (D and E) Signal propagation was blocked in the presence of (D) 100 μM carbenoxolone (cbx), a gap junction inhibitor, (E) but not apical apyrase. Arrows denote single denatonium-responsive cells. Images shown are representative of 5 to 12 experiments for each condition. Scale bar: 50 μm.

