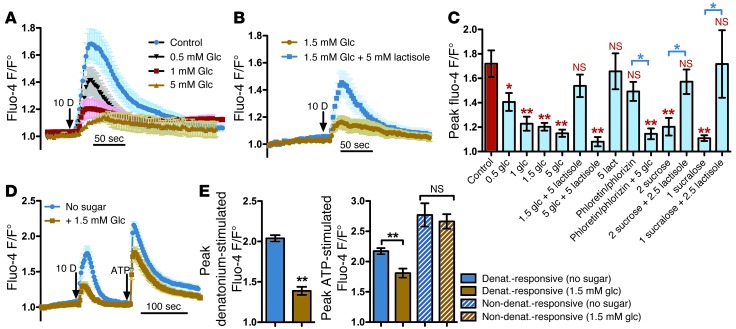
Figure 3. Sweet receptor activation inhibits T2R-activated calcium signaling.
(A) Dose-dependent glucose (Glc) inhibition of the calcium response to 10 mM denatonium benzoate (mean ± SEM; n = 5–9 experiments using cultures from at least 3 patients each). (B) Inhibition is reversed by lactisole (mean ± SEM; n = 5–7 cultures from at least 3 patients each). (C) Peak calcium responses (mean ± SEM; 6–12 cultures from at least 3 patients each) and inhibition by glucose, sucrose, and sucralose (but not phloretin/phlorizin) as well as reversal of inhibition by lactisole. Red asterisks denote significance versus control (10 mM denatonium stimulation alone) determined by 1-way ANOVA with Dunnett’s post-test. Blue asterisks denote significance between bracketed bars determined by 1-way ANOVA with Bonferroni post-test. Experiments in A–C were performed without carbenoxolone. (D) In the presence of carbenoxolone, single denatonium-responsive cells exhibited glucose inhibition of both denatonium- and ATP-induced calcium signals (mean ± SEM; 18–20 cells from 3 patients for each condition). (E) Peak denatonium-induced calcium response (mean ± SEM) in the presence of carbenoxolone with or without glucose (significance determined by Student’s t test) from experiments in D. ATP response (mean ± SEM) in denatonium-responsive (solid bars) and nonresponsive (hatched bars) cells (significance determined by 1-way ANOVA with Bonferroni post-test). *P < 0.05; **P < 0.01.

