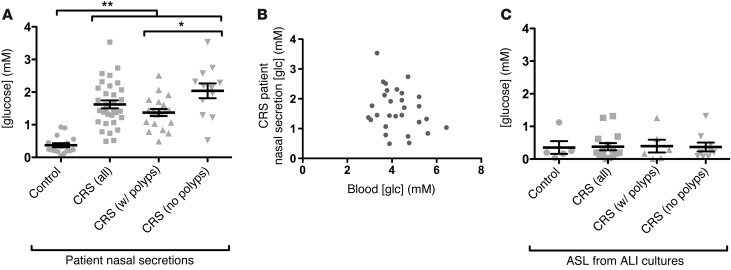
Figure 7. Glucose concentrations are elevated in the nasal secretions of patients with CRS.
(A) Glucose was measured in nasal secretions from patients with CRS and control individuals. Glucose was 0.37 ± 0.06 mM vs. 1.63 ± 0.12 mM in control patients (n = 17) and patients with CRS (n = 32), respectively. A significant difference was observed between patients with CRS with (n = 20) and without (n = 12) polyps (1.4 ± 0.1 mM vs. 2.0 ± 0.2 mM, respectively), but nonetheless both groups had significantly higher glucose than control patients (mean ± SEM). *P < 0.05, **P < 0.01, determined via 1-way ANOVA with Tukey-Kramer post-test. (B) In patients with CRS, there was no correlation between blood and nasal secretion glucose concentrations (n = 32 patients for which nasal and blood glucose values could be obtained). Additionally, none of the patients with CRS used in this study had a prior diagnosis of hyperglycemia, prediabetes, or diabetes. Previous studies have shown that hyperglycemia is correlated with increased nasal secretion glucose (51, 74, 75). However, these data suggest that the patients with CRS in this study exhibited higher nasal glucose levels due to another mechanism. (C) Glucose was measured in ASL from ALI cultures, with no difference observed among the populations (mean ± SEM; n = 1 culture each from 5 control patients and 15 patients with CRS, including 6 with polyps and 9 without polyps). No significant differences were detected by 1-way ANOVA.

