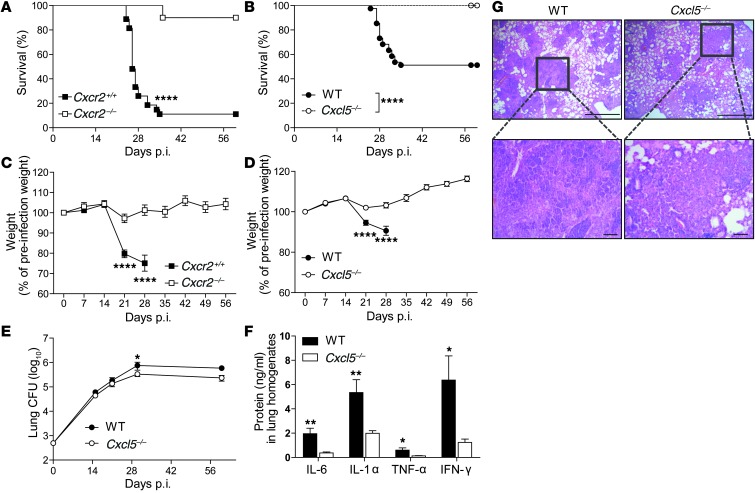
Figure 3. Absence of CXCL5 or its receptor CXCR2 protects from TB-associated wasting disease and death.
(A) Kaplan-Meier curves showing survival of Cxcr2+/+ (n = 27) and Cxcr2–/– (n = 20) mice after M. tuberculosis infection (∼570 CFUs). Results are pooled from 2 independent experiments (log-rank test). (B) Kaplan-Meier curves showing survival of WT (n = 41) and Cxcl5–/– (n = 36) mice after M. tuberculosis infection (∼500 CFUs). Results are pooled from 4 independent experiments (log-rank test). (C) Relative weight curves of Cxcr2+/+ and Cxcr2–/– mice during M. tuberculosis infection (∼570 CFUs, n ≥ 20 [nWT day 28 p.i. = 9]). Data are pooled from 2 independent experiments. (D) Relative weight curves of WT and Cxcl5–/– mice during M. tuberculosis infection (∼500 CFUs; n ≥ 36 [nWT day 28 p.i. = 35]). Data are pooled from 4 independent experiments. (E) Pulmonary M. tuberculosis burden in WT and Cxcl5–/– mice (∼500 CFUs; npooled = 9–10 per time point). Data are pooled from 5 independent experiments. (C–E) Mean ± SEM, 2-way ANOVA/Bonferroni post-test. (F) Proinflammatory cytokine levels in lung homogenates of WT and Cxcl5–/– mice at day 30 p.i. (mean ± SEM; npooled = 10). Data are pooled from 2 independent experiments (unpaired t test). (G) Lung histopathology at 21 days p.i. as shown by hematoxylin and eosin staining. Scale bar: 1,000 μm (top row); 100 μm (bottom row). Data are representative of 3 independent experiments (n = 3–5). *P < 0.05; **P < 0.01; ****P < 0.0001.

