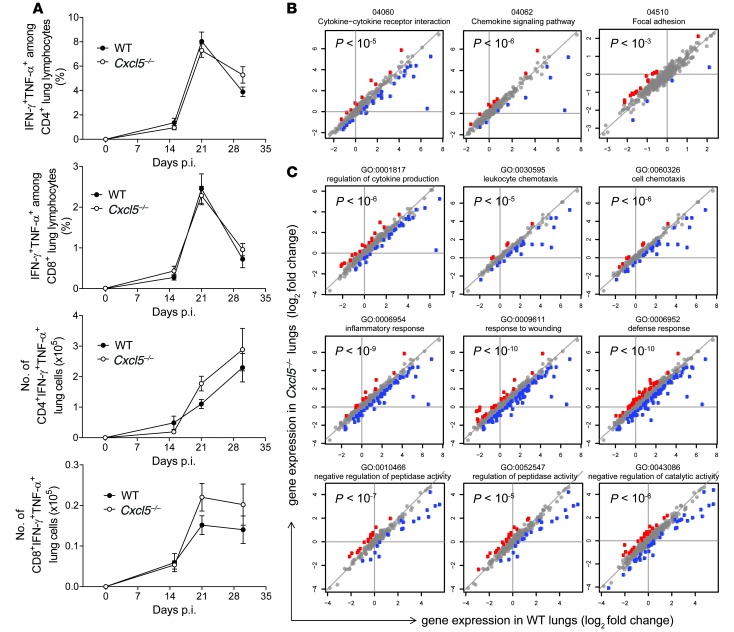
Figure 4. M. tuberculosis–specific type 1 T cell response and pathway analysis in Cxcl5–/– mice.
(A) Frequencies of IFN-γ+TNF-α+ cells among lung CD4 and CD8 T cells and numbers of IFN-γ+TNF-α+ lung CD4 and CD8 T cells after short-term in vitro restimulation with M. tuberculosis–derived peptides determined by flow cytometry (mean ± SEM; npooled ≥ 14 per time point except on day 0, when n = 10). Mice were infected with high-dose (∼500 CFU) M. tuberculosis. Each time point represents pooled data from at least 2 independent experiments. Curve data pooled from a total of 4 independent experiments (2-way ANOVA/Bonferroni post-test) did not reveal significant differences between groups at analyzed time points. (B) Significant selected pathways by SPIA analysis. P values correspond to pGFWER composite and multiple testing–corrected P values from SPIA analysis. Plots show log2 fold changes in gene expression of given pathways between naive and day 21 p.i. WT lungs (horizontal axis) and Cxcl5–/– lungs (vertical axis). Mice were infected with high-dose (∼500 CFUs) M. tuberculosis. Red denotes genes for which log fold change is significantly higher in the KO, and blue denotes genes for which log fold change is significantly higher in the WT. (C) Selected GO terms significant in GO enrichment analysis. P values correspond to significance of GO enrichment, corrected for multiple testing. Colors and axes are as in B.

