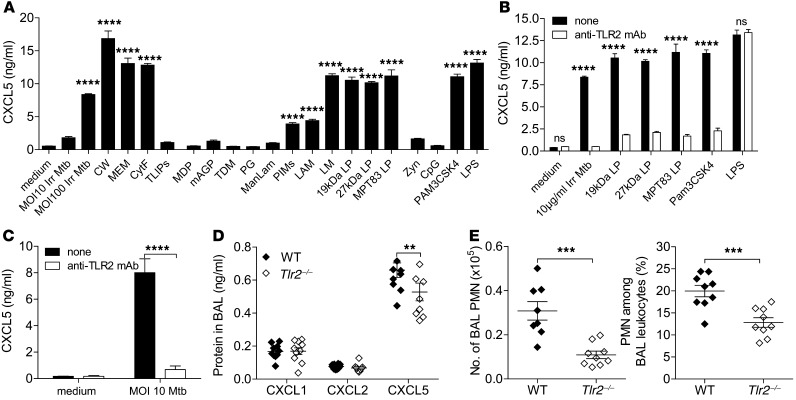
Figure 9. CXCL5 expression in epithelial cells is induced by M. tuberculosis TLR2 agonists.
(A) CXCL5 abundance measured by ELISA in supernatants of the AECII cell line (T7) stimulated with M. tuberculosis components and TLR agonists: γ-irradiated M. tuberculosis (Irr Mtb; MOI 10 and 100), 10 μg/ml cell wall (CW), 10 μg/ml membrane (MEM), 10 μg/ml cytosolic fraction (CytF), 10 μg/ml total lipids (TLIPs), 5 μg/ml muramyl dipeptide (MDP), 5 μg/ml mycolylarabinogalactan-peptidoglycan (mAGP), 5 μg/ml trehalose-6,6′-dimycolate (TDM), 5 μg/ml peptidoglycan (PG), 5 μg/ml mannose-capped lipoarabinomannan (ManLAM), 5 μg/ml phosphatidyl-myo-inositol mannosides 1 and 2 (PIMs), 5 μg/ml lipoarabinomannan (LAM), 1 μg/ml lipomannan (LM), 1 μg/ml 19-kDa lipopeptide (19kDa LP), 1 μg/ml 27-kDa lipopeptide (27kDa LP), 1 μg/ml MPT83 lipopeptide (MPT83 LP), 10 μg/ml zymosan (Zyn), 1 μM CpG, 1 μg/ml PAM3CSK4, 1 μg/ml LPS (1-way ANOVA/Bonferroni post-test). (B and C) CXCL5 concentration measured by ELISA in supernatants of AECII (T7) treated with and without anti-TLR2 mAb and (B) stimulated for 24 hours with γ-irradiated M. tuberculosis, 19-kDa and 27-kDa lipopeptides, MPT83, PAM3SCK4, or LPS and (C) infected with M. tuberculosis (Mtb) (2-way ANOVA/Bonferroni post-test). (A–C) Data are representative of 2 independent experiments (mean ± SEM; n = 3). (D) Chemokine measurements by ELISA and (E) PMN numbers and frequencies determined by flow cytometry in BAL fluid of high-dose (∼400 CFUs) M. tuberculosis–infected WT and Tlr2–/– mice (mean ± SEM; npooled = 10). Data are pooled from 2 independent experiments (2-way ANOVA/Bonferroni post-test). **P < 0.01; ***P < 0.001; ****P < 0.0001.

