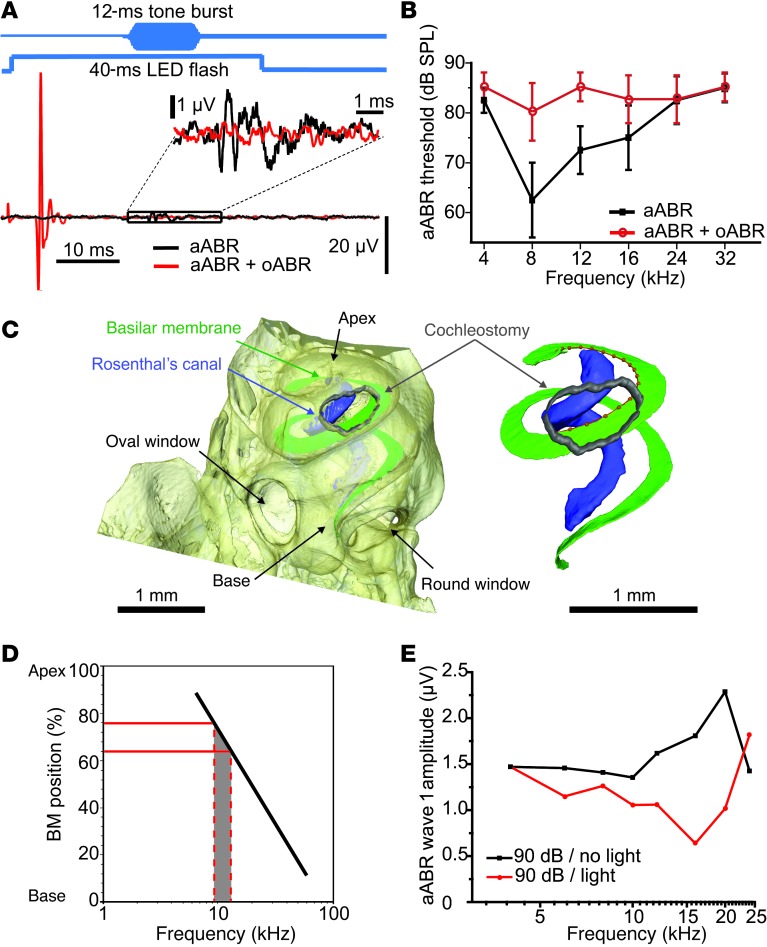
Figure 4. Interaction of optogenetic and acoustic cochlear stimulation.
(A) Following careful cochleostomy and positioning of a μLED, regular and light-masked acoustic thresholds were estimated by application of tone bursts of varying sound pressure levels (SPLs) and frequencies in the absence of optical stimulation (black) or following the cessation of an oABR that occurred at the onset of a concomitant 40-ms light stimulation (red). (B) Average aABR audiogram of four cochleostomized mice (best threshold not exceeding 70 dB) in the absence (black) and presence (red) of concomitant light; threshold increase upon light indicates masking due to a preceding optogenetic stimulation of the same population of neurons. (C) Tomography of an explanted mouse cochlea based on cone-beam in-line phase contrast at a compact laboratory x-ray source and a fast phase reconstruction procedure. Bony structures were segmented automatically; the basilar membrane (green), Rosenthal’s canal (blue), and cochleostomy (gray) were traced with semiautomatic segmentation. A spline curve was fitted to the basilar membrane and was used to identify the position of the cochleostomy relative to the tonotopic map of the cochlea (D, modified from ref. 36). See Methods for further description. (E) Light-on-tone masking assessed as the change in P1–N1 aABR amplitude with simultaneous μLED stimulation.

