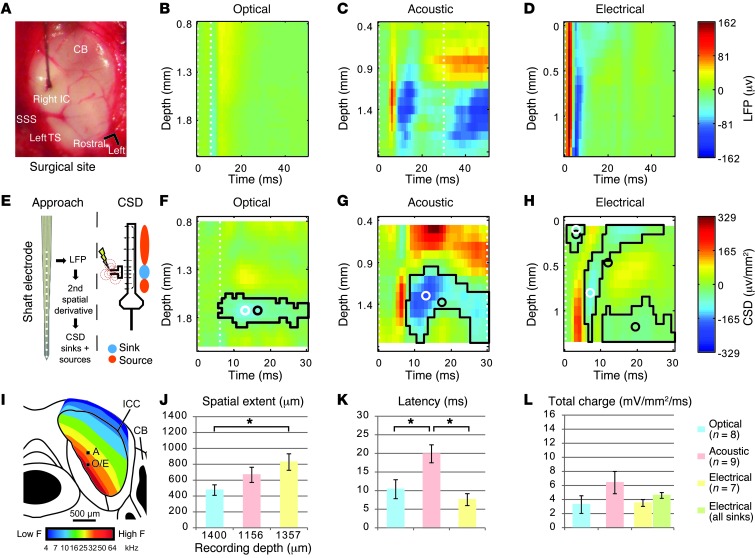
Figure 5. Assessment of the spread of cochlear excitation during optogenetic, acoustic, and electrical stimulation with multielectrode array recordings in the IC.
(A) Surgical site with recording electrode inserted into the right ICC. SSS, superior sagittal sinus; TS, transverse sinus; CB, cerebellum. (B–D) False color–coded representative profiles of LFPs evoked by optical (B), acoustic (C), and electrical (D) stimulation, recorded with multielectrode arrays. Note that the absolute depth (ordinate) differs between B–D, because maximum responses were found in different IC layers. Dashed lines indicate stimulus duration. (E) Profiles of LFPs were transformed into CSD patterns via the second spatial derivative (42). (F–H) Illustrative CSD patterns after optical, acoustic, and electrical stimulation, respectively. Sinks are plotted in blue and sources in red. Significant sinks are outlined in black, with centroid and peak highlighted by black and white open circles. Note that multiple sinks were usually identified for electrical stimulation. (I) Schematic representation of the tonotopic map of a mouse IC (modified from ref. 37). Average recording depth (black squares) at which the sinks were identified was plotted at estimated electrode positions. A, acoustic; O, optical; E, electrical stimulation. (J–L) Characterization of sinks for the three different stimulation modalities. If several sinks were found, the sink with the largest total charge was used for further analysis. (J) Maximum spatial extents and recording depth at which the sink was found. (K) Peak latencies. (L) Total carried charge. The green bar indicates the charge carried by all sinks.

