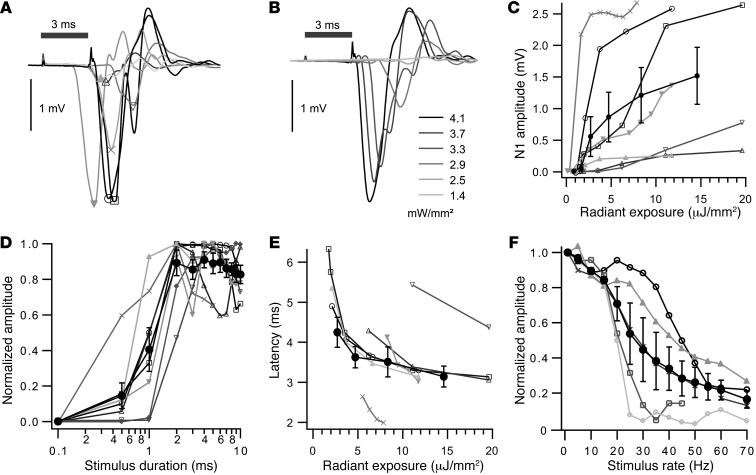
Figure 6. Effects of stimulus properties on oABRs.
(A) oABRs of 8 mice elicited by focusing the light of an external power LED (5 ms, 4 mW/mm2 at 1 or 5 Hz) onto the cochleostomy. Symbols indicate N1. Gray line values identify the same mice across A and C–E, and symbols additionally aid the identification of mice throughout C–F. (B) oABR stimulation of increasing irradiance (3-ms pulse duration at 1 Hz) of an exemplary mouse. (C) Increase of N1 amplitude with radiant exposure (irradiances as in B; pulse duration of 2, 3, or 5 ms at 1 Hz). Group average is indicated by black filled circles. (D) Increase in N1 amplitude (normalized for maximum amplitude) with stimulus duration. (E) Latency of oABRs (defined as N1 passing through 0.1 mV) as a function of irradiance. Group average is indicated by black filled circles. (F) Decrease in N1 amplitude (normalized for maximum amplitude) with stimulus rate (black filled circles indicate group average).

