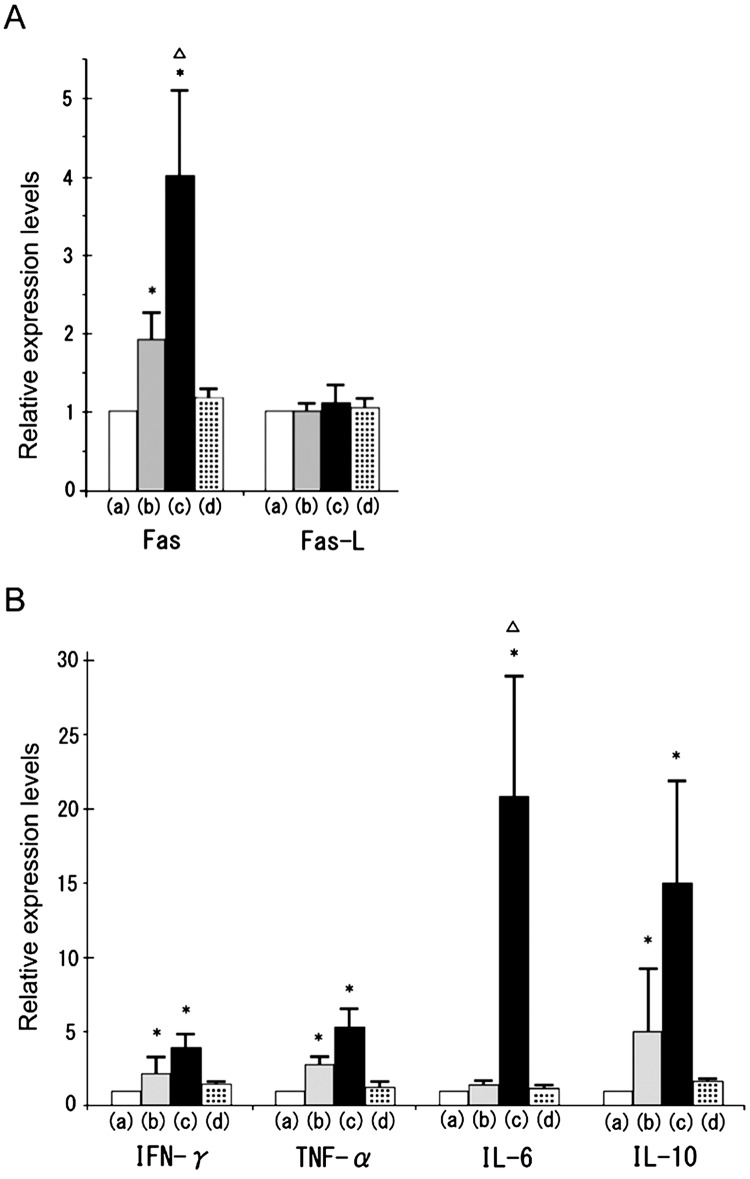
Fig. 3.
Expression of apoptosis-related gene and cytokines. Fas and Fas-L (A), IFN-γ, TNF-α , IL-6, and IL-10 (B) mRNA expressions were analyzed by real-time RT-PCR in the testes of the control group (a), TH group (b), TH+CFA+BP group (c) and CFA+BP group (d). Relative intensity was calculated, and then the expression in the controls for the other groups was normalized to 1.0. Each bar represents a mean ± SD (n = 4). *P<0.05 vs. the respective control group; ∆P<0.05 vs. the respective TH group.

