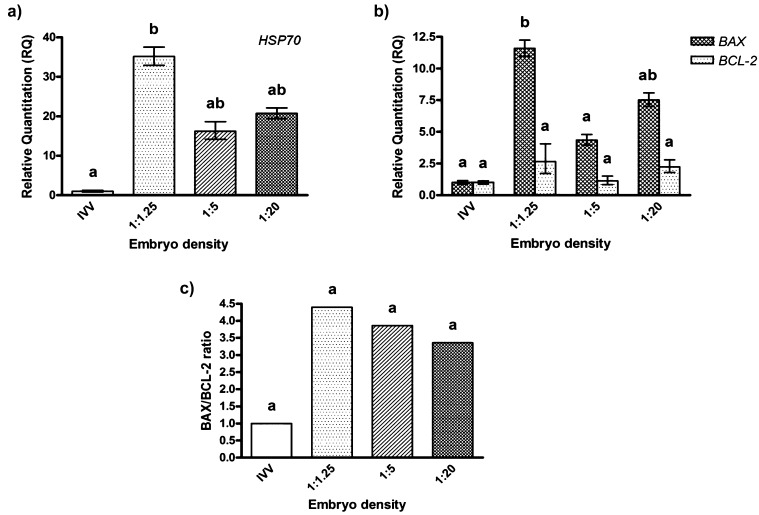
Fig. 4.
Comparison of specific transcripts analyzed by real-time PCR in feline blastocysts produced in vivo (IVV) and in vitro at densities of 1:1.25, 1:5 and 1:20. Mean values were obtained from three independent replicates. Bars indicate the upper and lower bounds of values. a, b Different superscripts denote values that differ significantly (P<0.05).

