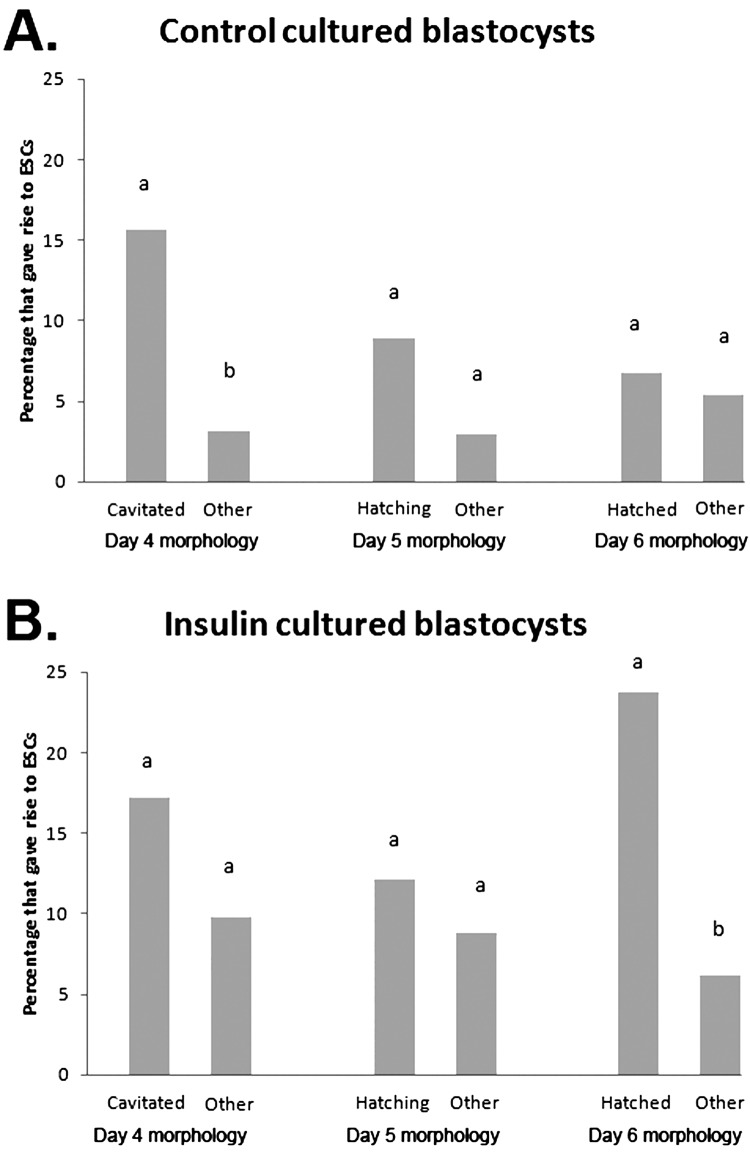
Fig. 6.
The effect of morphological state on days 4, 5 and 6 on the likelihood of blastocysts giving rise to ESC colonies. A: Percentage of blastocysts cultured in control conditions at the indicated morphological states which ultimately gave rise to a primary ESC colony, B: Percentage of blastocysts cultured with insulin at the indicated morphological states which ultimately gave rise to a primary ESC colony. Data are the number of blastocysts which generated ESCs expressed as a percentage of all blastocysts at that morphological stage. N≥44 (9 replicate experiments). Superscripts a and b within paired columns differ at P<0.05.

