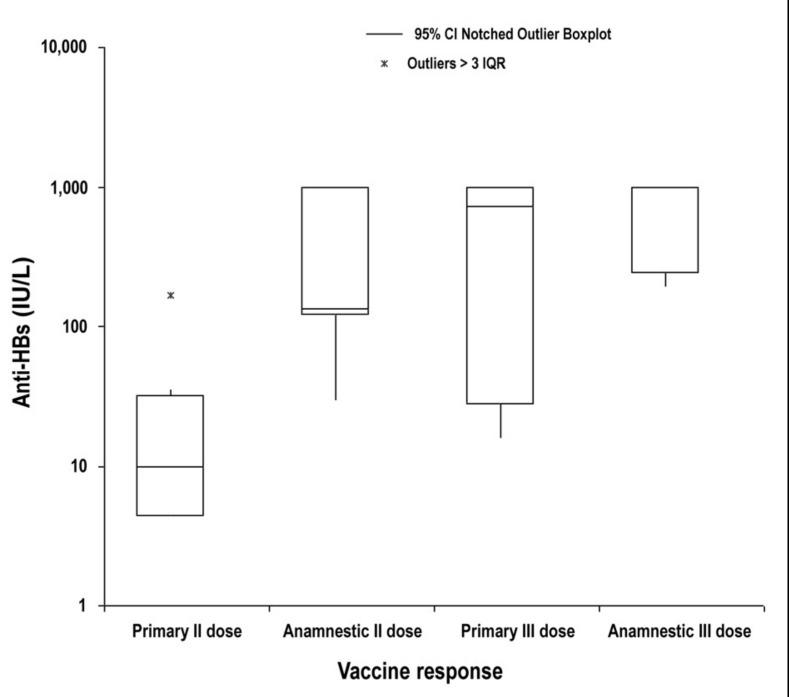
Figure 2.
Distribution of anti-HBs values (IU/L) on a logarithmic scale after the second and third doses of HBV vaccine in subjects showing a primary and an anamnestic response. The median values after the second dose (10 and 134 IU/L, respectively) are significantly different (P =0.017), while those after the third dose (726 and 1,000 IU/L) are not.

