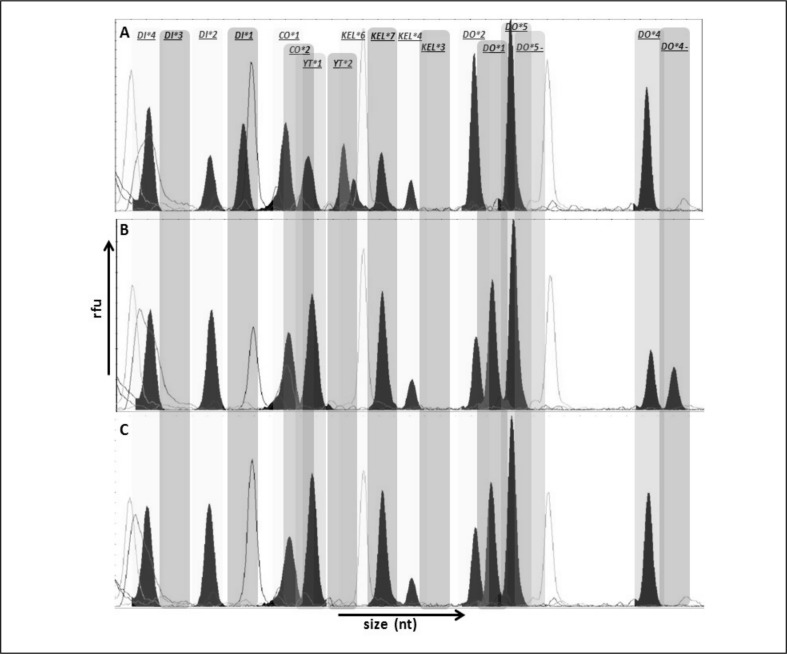
Figure 2.
GeneMapper electropherograms of representative SNaPshot fragment analysis of nine SNP. Bins are labelled at the exact place where each allele should migrate.
The X and Y axes represent size (nucleotides) and rfu (relative fluorescence units), respectively. (A) Sample genotyped as: DI*4/DI*4, DI*1/DI*2, CO*1/CO*1, YT*1/YT*2, KEL*6/KEL*7, KEL*4/KEL*4, DO*2/DO*2, DO*5/DO*5, DO*4/DO*4. (B) Sample genotyped as DI*4/DI*4, DI*2/DI*2, CO*1/CO*1, YT*1/YT*1, KEL*7/KEL*7, KEL*4/KEL*4, DO*1/DO*2, DO*5/DO*5, DO*4/DO. (C) Sample genotyped as DI*4/DI*4, DI*2/DI*2, CO*1/CO*1, YT*1/YT*1, KEL*6/KEL*6, KEL*4/KEL*4, DO*2/DO*2, DO*5/DO*5, DO*4/DO*4.

