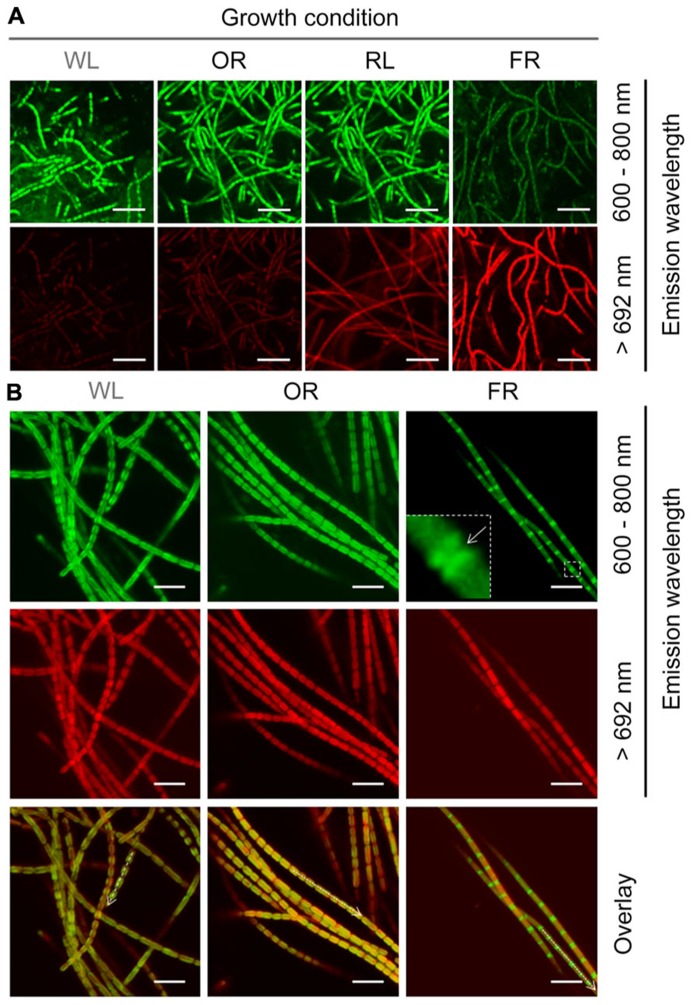
FIGURE 8.
Confocal fluorescence images of H. hongdechloris cells grown under different light conditions. Autoflourescence of cells excited with 458 nm light were collected using either a 600–680 nm band-pass filter or a 692 nm long-pass filter (>692 nm). (A) Confocal fluorescence images of cells grown under WL, FR, OR, or RL light. All data were collected using identical laser intensity and gain settings. Bar = 10 μm. (B) Confocal fluorescence images of cells grown in WL, OR, or FR light conditions. Fluorescence emission at 600–680 nm was detected uniformly around the periphery of cells grown in other selected lights whereas in FR light grown cells this fluorescence was concentrated in the septa. Intensities of the different fluorescence wavelengths along the axis of the dotted arrows in the overlay are plotted in the lower panel. Different laser intensities and gain settings were used in order to collect normalized fluorescence intensities. Bar = 5 μm.

