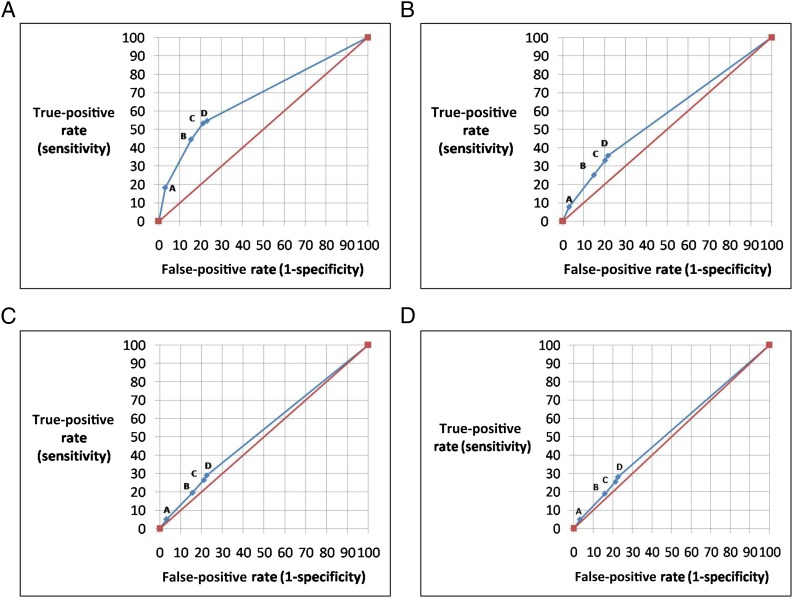
FIGURE 1.
ROC curves for RBUS as a screening test for GU abnormalities on VCUG. Each graph represents specific VCUG outcome threshold. Points on each curve represent each RBUS thresholds A through D (see Table 1). A, ROC curve for VCUG-A (urethral findings or major bladder findings or VUR > grade III). Area under curve (AUC) = 0.674. B, ROC curve for VCUG-B (urethral findings or major bladder findings or VUR > grade II). AUC = 0.573. C, ROC curve for VCUG-C (urethral findings or major bladder findings or VUR > grade I). AUC = 0.532. D, ROC curve for VCUG-D (urethral findings or major bladder findings or any VUR). AUC = 0.527.

