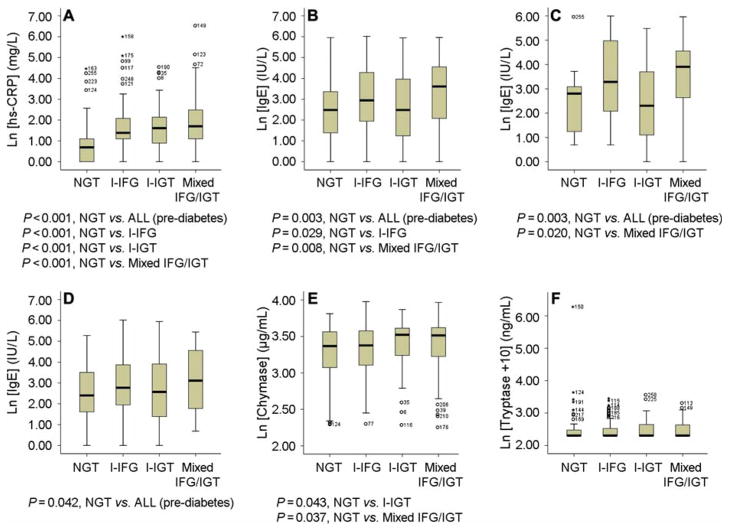
Figure 1.
Box plots of hsCRP, IgE, chymase, and tryptase among NGT patients and patients with different categories of pre-diabetes. A: Plasma hsCRP levels from NGT, I-IFG, I-IGT, and mixed IFG/IGT patients. B: Plasma IgE levels from the same four categories. C: Plasma IgE levels in male subjects. D: Plasma IgE levels in female subjects. E: Plasma chymase levels. F: Plasma tryptase levels. All data are mean ± SD. P < 0.05 was considered statistically significant; non-parametric Mann–Whitney U test. Non-significant comparisons are not shown.

