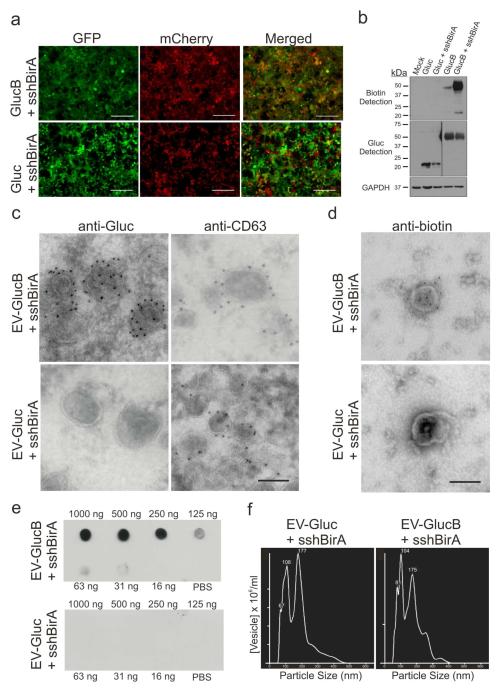
Figure 2. GlucB and sshBirA label and biotinylate EVs on the surface.
(a, b) Stable HEK293T cells expressing sshBirA with GlucB or Gluc. (a) Live-cell imaging of HEK293T cells stably transduced with GlucB-IRES-GFP or Gluc-IRES-GFP vectors, both with sshBirA-IRES-mCherry. Bar, 100 μm. (b) Western blot analysis showing enhanced biotinylation of cells stably expressing GlucB with sshBirA, as compared to GlucB alone. No biotinylation was detected in cells expressing Gluc alone or Gluc with sshBirA. Immunoblotting with anti-Gluc antibodies showed Gluc and GlucB at expected sizes (Gluc: 20 kDa; GlucB: 42 kDa). A low level of biotinylated BAP domain (22 kDa) was also detected in GlucB and GlucB + sshBirA samples. Mock transduced HEK293T were used as a negative control. GAPDH was immunoprobed as a loading control. (c, d) Transmission electron micrograph (TEM) demonstrating biotinylation and Gluc labeling of EV-GlucB on the membrane. (c) Sectioned EVs were immunolabeled with either anti-CD63, an exosome marker,21 or anti-Gluc antibody followed by gold-conjugated secondary antibody to visualize GlucB labeling of EVs on the membrane, with EV-Gluc showing no Gluc signal but having the CD63 signal. Bar, 100 nm. (d) EVs in suspension were immunolabeled with an anti-biotin antibody followed by 10 nm gold-conjugated secondary antibody and biotinylation of EV-GlucB, but not EV-Gluc surface was detected. (e) Dot blot detection of biotinylated EVs. EVs isolated from HEK293T cells stably expressing sshBirA with either GlucB (top) or Gluc (bottom) were dot blotted on nitrocellulose membranes in a dose range followed by probing with streptavidin-HRP and chemiluminescence detection. EV-GlucB showed quantity-dependent biotinylated EVs, whereas EV-Gluc control exhibited no biotinylation background signal. (f) Nanoparticle tracking analysis (NTA) of EVs. Similar size distribution between EV-Gluc (peaks: 67, 100 and 177 nm) and EV-GlucB (81, 104 and 175 nm) vesicles was detected.

