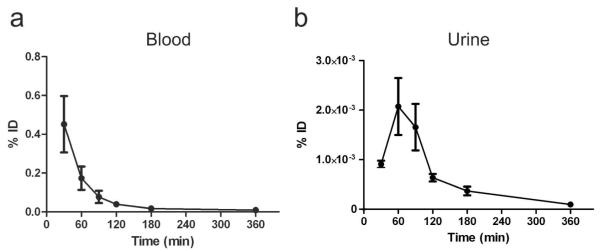
Figure 6. EV-GlucB distribution in biofluids.

Blood (a) and urine (b) were collected at various time points after IV-injection of EV-GlucB, and Gluc activity was measured to evaluate blood levels and urine clearance of EV-GlucB. % ID, percent of initial dose.
