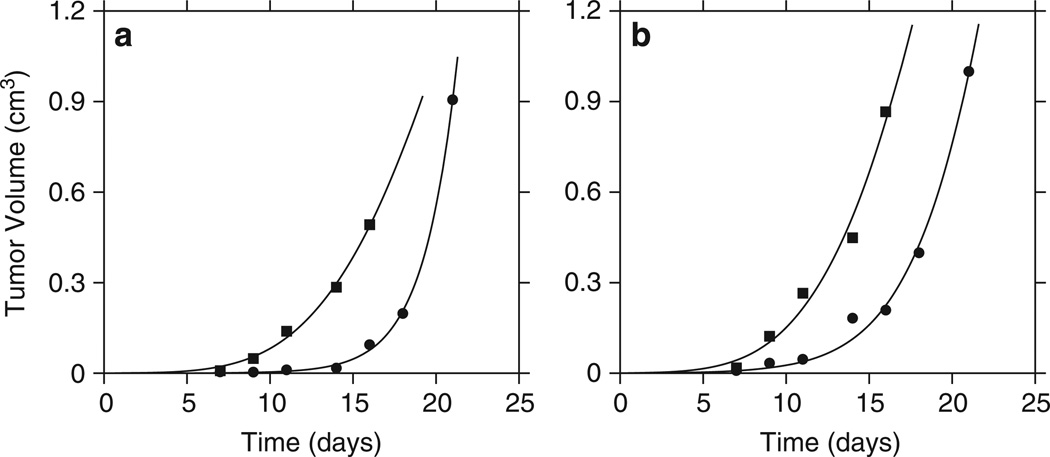
Figure 1.
Fitting of tumor growth models to in vivo data. Each curve represents serial data on one tumor with a total of four tumors represented. (a) The tumors were injected with PBS. (b) The tumors were injected with HI virus. The square symbols represent fitting of data by the Gompertz model, which was preferred according to the used model selection criteria (ΠA=0.0028; ΠB=0.011). The circles correspond to data fitting using the generalized logistic model (ΠA=0.0026; ΠB=0.024).

