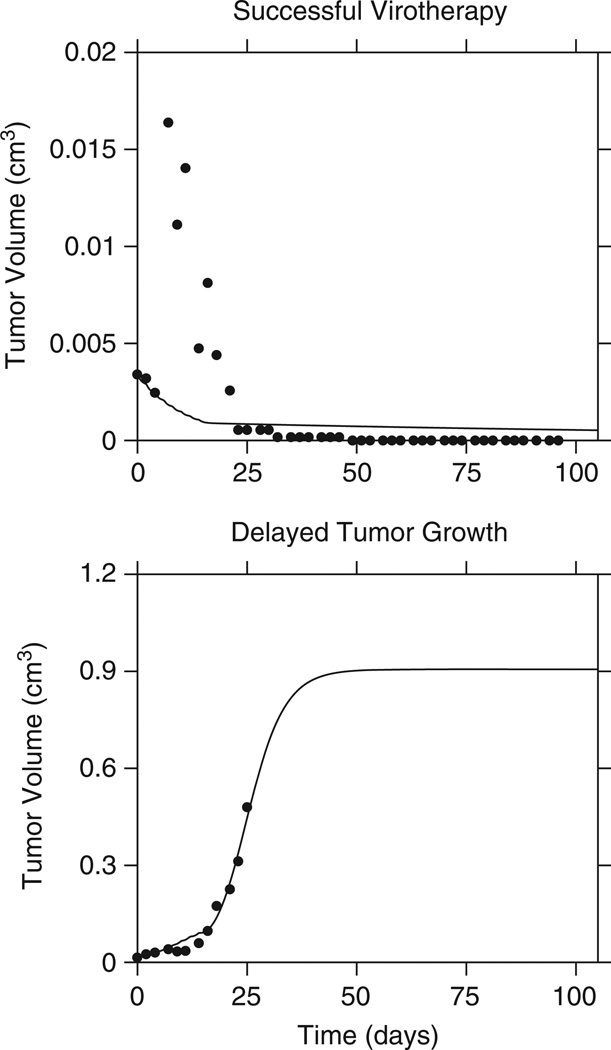
Figure 6.
Preexisting immunity and the outcome of therapy. Treated tumor growth data were simultaneously fitted as in Figure 4. However, here z0 (see text) is introduced as a free parameter fitted for each set of data, yielding z0=108 for successful therapy and z0=5×10⁷ for delayed growth (Πcured=0.924; Πfailed=0.026).

