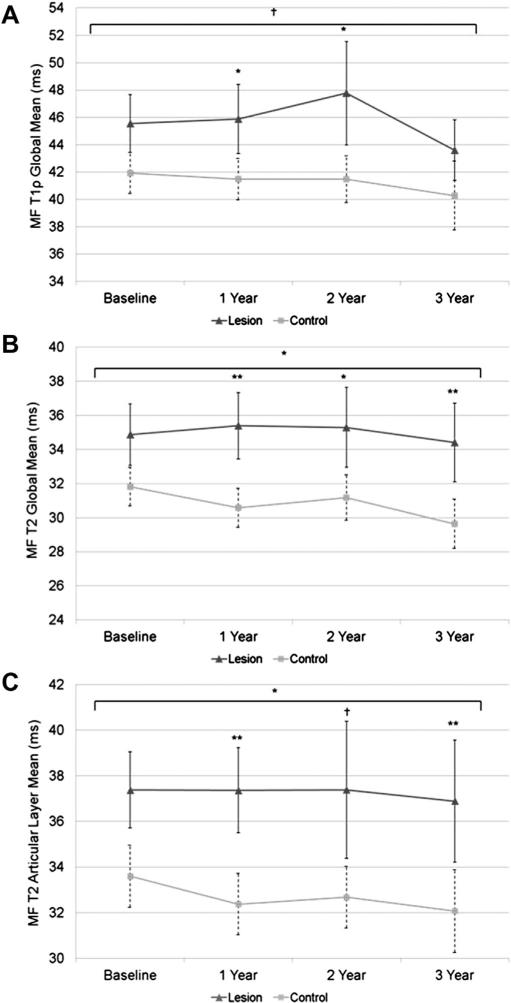
Fig. 3.
Global mean T1ρ and T2 relaxation times (A and B) and mean articular layer T2 relaxation times (C) in the MF. Single asterisk indicates P < 0.05, double asterisk indicates P < 0.01, and cross indicates P = 0.07–0.051 (approaching significance). Longitudinal significance between the groups is denoted above the horizontal bracket.

