
Figure 2.
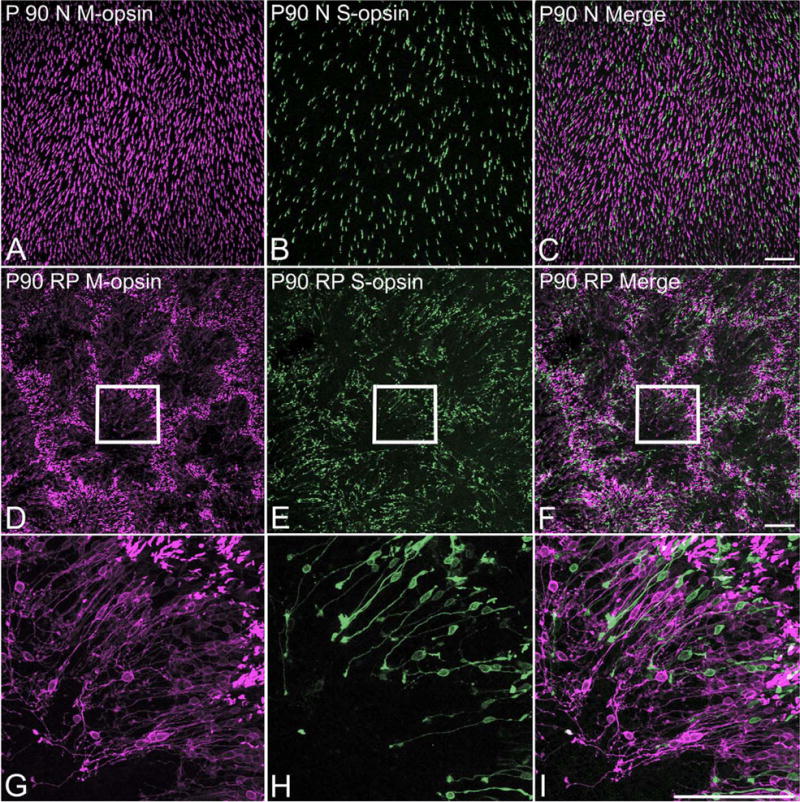
Confocal micrographs taken from whole mounts processed for M-opsin and S-opsin immunoreactivities. Low-power micrographs illustrate the homogeneous distributions of M-opsin (A) and S-opsin (B) cones in P90 normal retina. Double exposure (C) demonstrates no colocalization of M-opsin and S-opsin immunoreactivity. Low-power micrographs show that M-opsin (D) and S-opsin (E) cones in P90 RP retinas exhibit spatial organizations in matrices of rings. Double exposures (F) demonstrates that both types of cones form rings at the same locations in the RP retinas. High-power micrographs of part of a ring marked with inset rectangles in D–F, are shown in G–I, respectively. The orientation of M-opsin (G) and S-opsin (H) immunoreactive cones in rings are shown. Double exposures (I) demonstrates the same orientation of M-opsin and S-opsin cones. Scale bars = 100 μm. [Color figure can be viewed in the online issue, which is available at wileyonlinelibrary.com.]