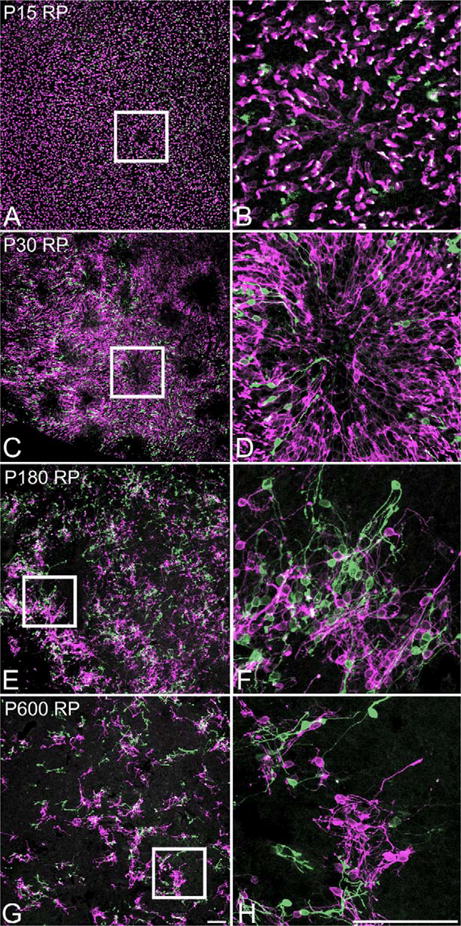
Figure 5.

Confocal micrograph taken from whole mount RP retina processed for M-opsin (red) and S-opsin (green) immunoreactivities at P15 (A,B), 30 (C,D), 180 (E,F), and P600 (G,H). Double exposure shows a ring of M-opsin and S-opsin immunoreactive cone at P15 (A). A higher-power micrograph of a ring is shown (B). It illustrates the change of orientation of cones; starting to lie flat with their processes pointing toward the center of the ring. Many rings are visible by P30 (C). D: Higher-power micrograph of a ring is shown (C). All the COS and the cell bodies are near the rims of the rings, whereas the processes are pointing toward the center of the ring. At P180, rings start to lose their form (E). Higher-power micrograph of a part of what probably used to be a ring reveal M-opsin- and S-opsin-immunoreactive cones are no longer organized in the previously observed orientation (F). A lot of cones show growth of abnormal processes and loss of their OS. At P600, rings are no longer clear (G). Higher-power micrograph illustrates the cones' extensive growth of processes and their loss of OS (H). Scale bars = 100 μm. [Color figure can be viewed in the online issue, which is available at wileyonlinelibrary.com.]
