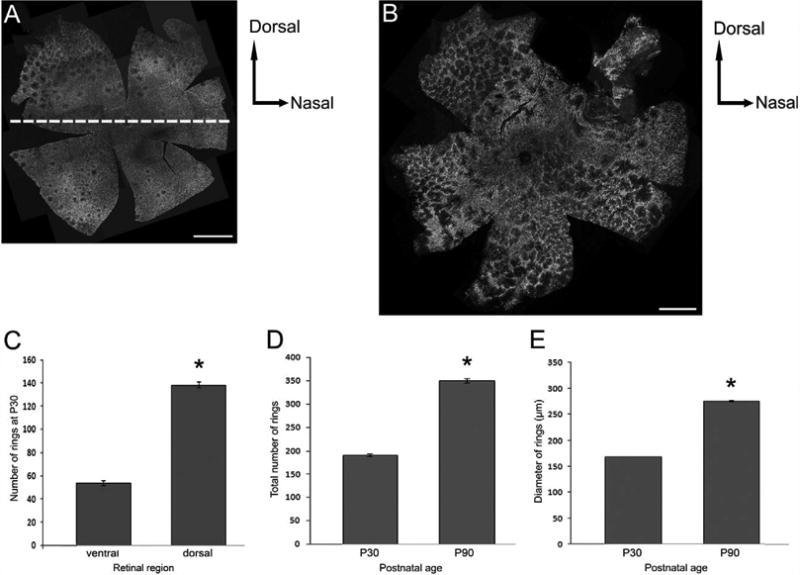
Figure 6.

Composite image of confocal micrographs taken from the whole mount RP retinas processed for M-opsin immunoreactivities at P30 (A) and at P90 (B). At P30 there are comparatively more rings in the dorso-peripheral region of the retina. At P90 rings are seen throughout the entire retina. A graph of the mean total number of rings versus retinal regions of the P30 RP retinas (n = 3) suggest significantly greater number of rings in the dorsal region of the retinas compared to the ventral region (C). A graph of mean total number of rings versus postnatal age (n = 3; D) and a graph of mean diameter of rings (μm) versus postnatal age (n = 2; E) indicate rings grow both in their number and size from P30 to P90. Data presented as mean ± standard error. *P < 0.005 or better. Scale bars = 1 mm.
