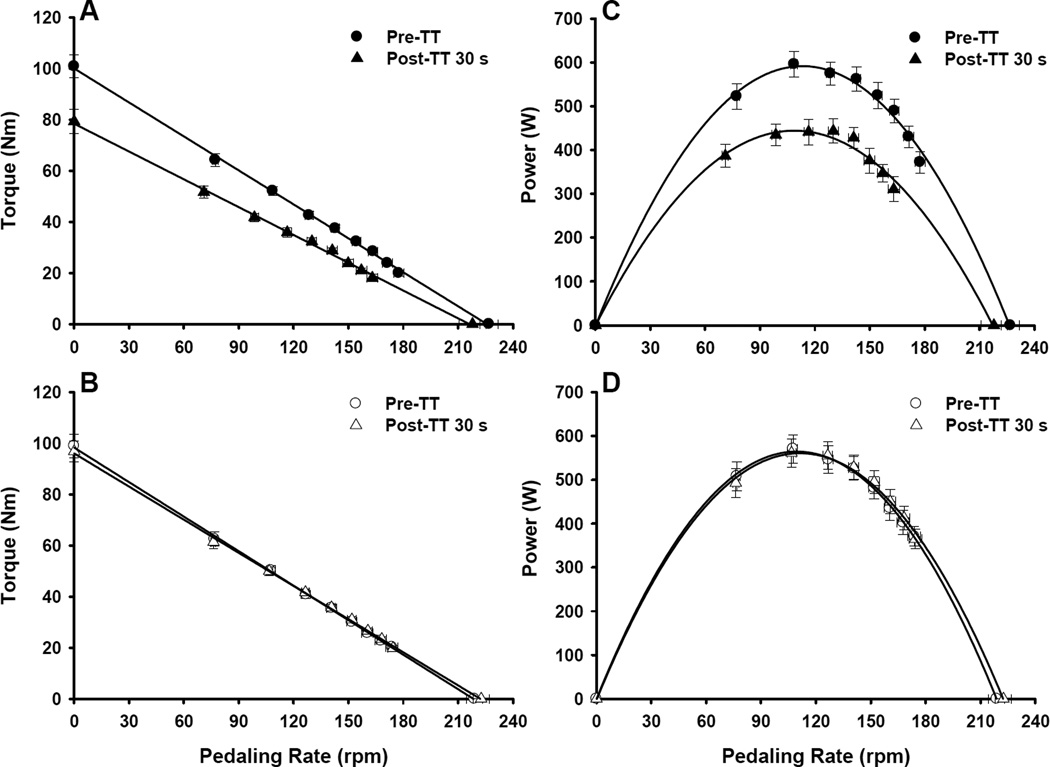
Figure 4.
Maximal cycling torque-pedaling rate (A, B) and power-pedaling rate (C, D) relationships for the fatigued ipsilateral (closed symbols) and rested contralateral leg (open symbols). Maximum isometric torque and maximum power were reduced for the fatigued ipsilateral leg at 30 s post-TT, but did not change for the rested contralateral leg. Data are presented as mean ± SEM.

