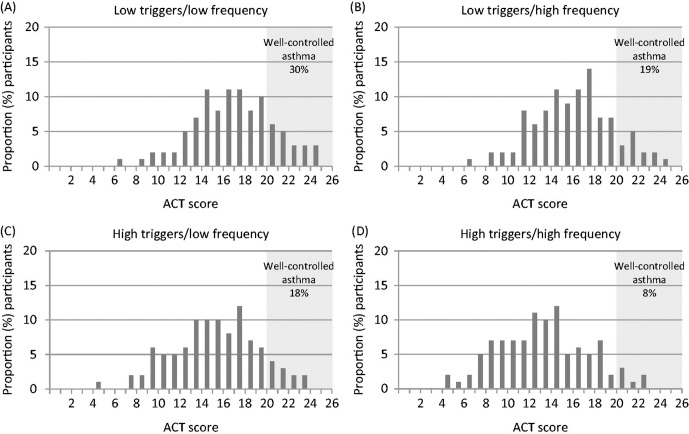
Figure 1.
Relationship between trigger burden (exposure and frequency) and asthma control as measured by the ACT score (total participants = 1202). Panel A depicts participants (n = 696 [58%]) with a low to medium asthma trigger burden (<16 self-reported known asthma triggers) and a low total frequency burden (annual frequency index <0.5). Panel B depicts participants (n = 107 [9%]) with a low to medium asthma trigger burden (<16 self-reported known asthma triggers) and a high total frequency burden (annual frequency index ≥0.5). Panel C depicts participants (n = 278 [23%]) with a high asthma trigger burden (≥16 self-reported known asthma triggers) and a low total frequency burden (annual frequency index <0.5). Panel D depicts participants (n = 121 [10%]) with a high asthma trigger burden (≥16 self-reported known asthma triggers) and a high total frequency burden (annual frequency index ≥0.5). The shaded area on each panel depicts well controlled asthma (ACT score >20).

