Figure 4.

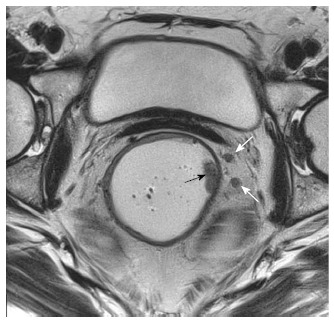
T1 N+ tumor. T2W axial magnetic resonance image shows two small nodes in the mesorectal fat on the left (white arrows) with irregular borders and signal intensity similar to primary tumor along left lateral wall (black arrow).

T1 N+ tumor. T2W axial magnetic resonance image shows two small nodes in the mesorectal fat on the left (white arrows) with irregular borders and signal intensity similar to primary tumor along left lateral wall (black arrow).