
Figure 1.
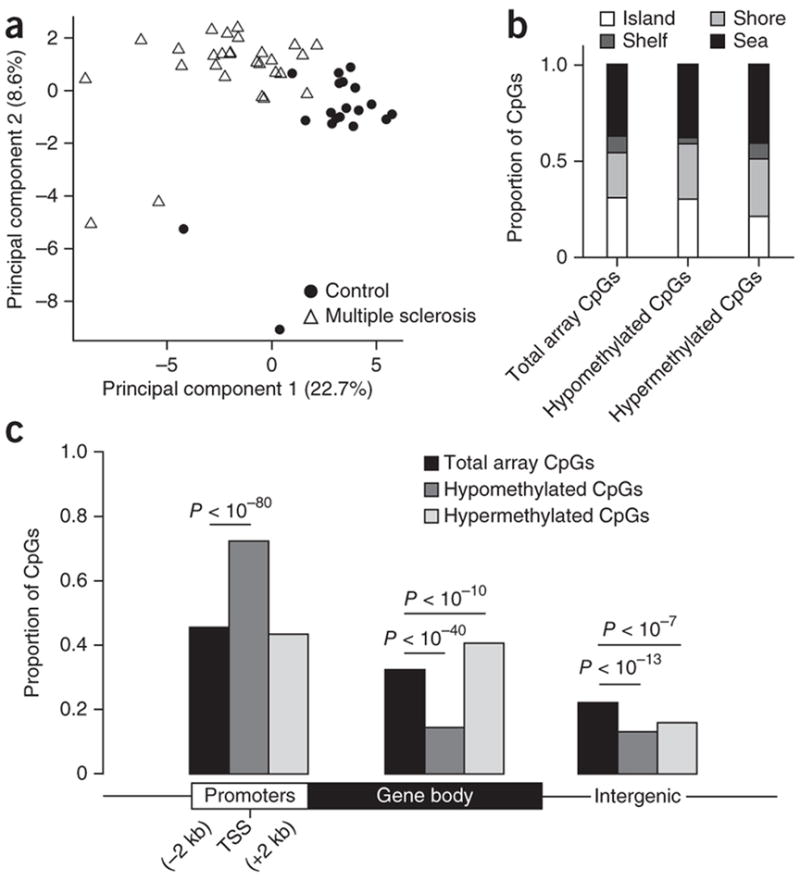
Differential distribution of DNA methylation in multiple sclerosis–affected brains. (a) Principal component analysis of 28 multiple sclerosis cases (triangles) and 19 controls (circles) based on methylation levels of all CpGs within DMRs identified by a sliding window analysis. Plotted are the first and second principal components. Percentage of variation explained by each is given in parentheses. (b,c) Distribution of CpG sites in CpG islands, shores, shelves and sea (b) and relative to RefSeq gene promoters, gene bodies and intergenic regions (c). CpGs in hypomethylated and hypermethylated DMRs are compared to all autosomal CpGs on the Illumina array using Pearson’s chi-squared test.