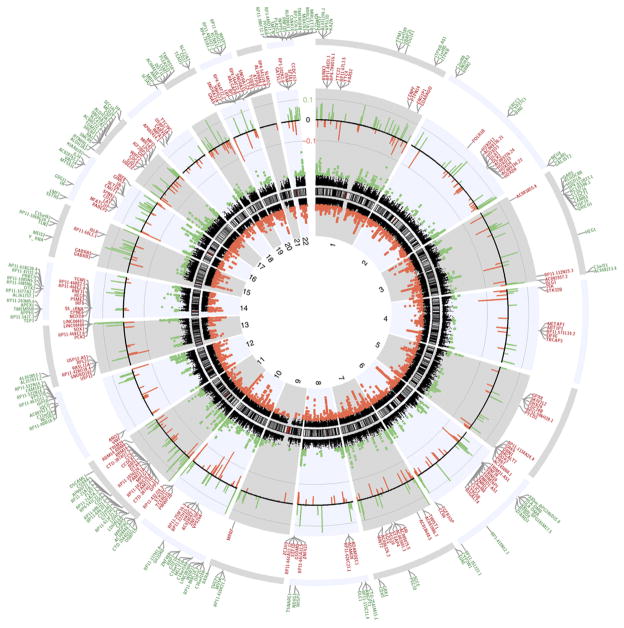
Figure 3.
Circos plot of genome-wide DNA methylation changes between brains of individuals with multiple sclerosis and controls without neurological disease. Circular representation of the genome. The black innermost ring (with vertical lines) represents autosome ideograms (annotated is the chromosomal number), with the pter-qter orientation in a clockwise direction. Small red lines represent the centromeres within each chromosome. The dots inside and outside of the ideogram represent the Fisher’s method −log10(P value) for each 1-kb window analyzed. Black dots outside the ideograms mark hypermethylated windows (green dots denote significant hypermethylated windows), while dots inside mark hypomethylated windows (red dots denote significant hypomethylated windows). Each dot also marks the location of the Illumina 450K probe distribution along the genome. The second outermost black circle represents baseline (zero) and the β-value difference between multiple sclerosis and controls for significant windows after age and gender correction. Green lines signify hypermethylated regions and red hypomethylated, with the length of each line representing the difference level. The last two circles show the RefSeq genes associated with differentially methylated regions: inner circle, genes associated with hypomethylated DMRs (red); outer, genes associated with hypermethylated DMRs (green). Only genes with a FDR q value <0.005 are shown.

