
Figure 5.
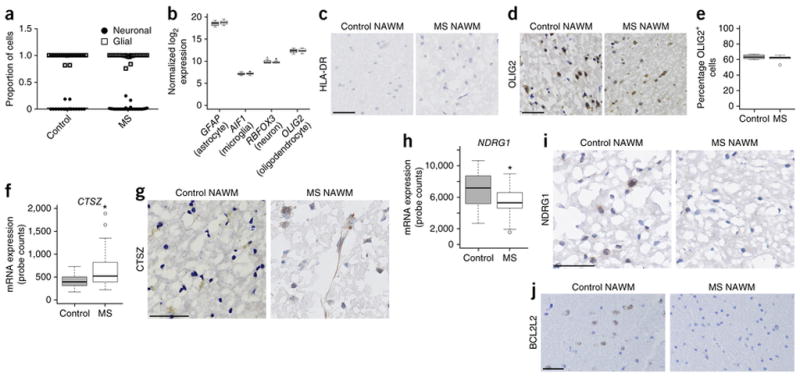
Cell composition does not affect changes detected by immunohistochemistry. (a) Scatter plot of neuronal (circle) and glial (square) cell contributions to the methylation signature for each individual sample from control and multiple sclerosis–affected brains. (b) Box and whisker plot of normalized log2 expression for GFAP, AIF1, RBFOX3 and OLIG2. In b,f,h, whiskers indicate 1.5 times the interquartile range; bottom and top of the boxes, first and third quartiles, respectively; center lines, second quartile. (c) Representative HLA-DR for control (n = 5 brain samples) and multiple sclerosis (n = 10 brain samples) sections. Scale bar, 50 μm. (d) Representative OLIG2 staining for control (n = 5 brain samples) and multiple sclerosis (n = 10 brain samples) sections. Scale bar, 50 μm. (e) Percentage of OLIG2+ cells in these sections. Whiskers indicate 1.5 times the interquartile range. (f) Expression (normalized NanoString assay counts) for CTSZ (control n = 18 RNA brain samples, multiple sclerosis n = 26 RNA brain samples; *P < 0.05). Whiskers indicate 1.5 times the interquartile range. (g) Representative CTSZ staining for control (n = 5 brain samples) and multiple sclerosis (n = 10 brain samples) sections. Scale bar, 50 μm. (h) Expression (normalized NanoString assay counts) for NDRG1 (control n = 17 samples, multiple sclerosis n = 26 samples; *P < 0.05). Whiskers indicate 1.5 times the interquartile range. (i) Representative NDRG1 staining for control (n = 5 brain samples) and multiple sclerosis (n = 10 brain samples) sections. Scale bar, 50 μm. (j) Representative BCL2L2 staining for control (n = 5 brain samples) and multiple sclerosis (n = 10 brain samples) sections. Scale bar, 50 μm. MS, multiple sclerosis.