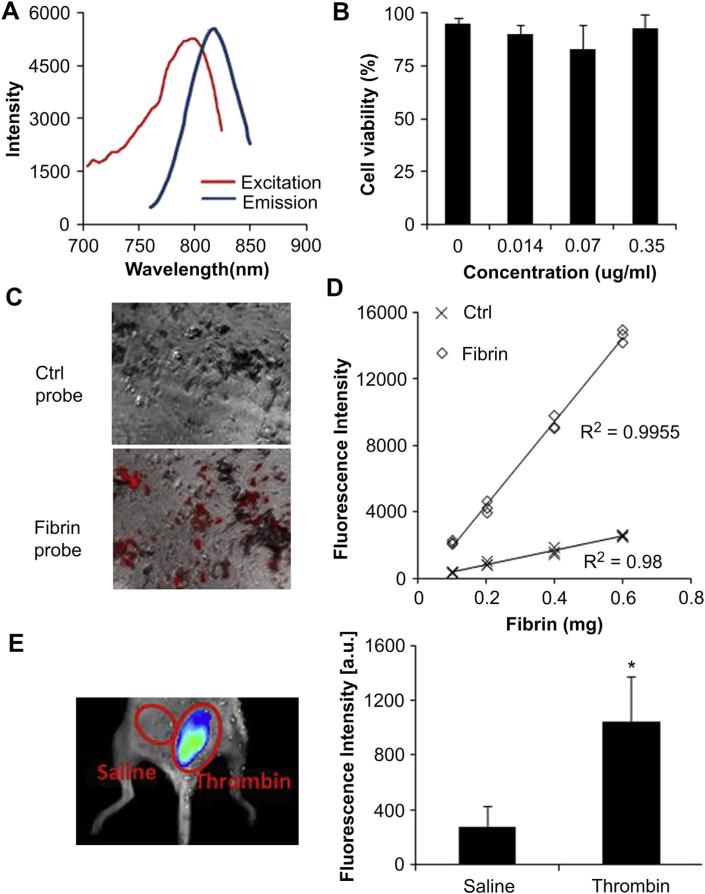
Fig. 2.
Characterization of fibrin-affinity probes and assessment of the specificity of fibrin in vitro and in vivo. (A) Excitation and emission spectra of fibrin-affinity probes (B) Cytotoxicity study of fibrin-affinity probes using an MTS assay. (C) Fluorescence microscopy images of fibrin clots on the glass beads incubated with fibrin-affinity probes and control probes (red color represents the probe). (D) Correlation between fibrin amounts and fluorescence intensities following incubation with either fibrin-affinity probes or control probes. (E) The merged fluorescence and white light images (left panel) show the accumulation of the fibrin-affinity probes at thrombin injection sites, but not the control site (saline injection). The mean fluorescence intensities at thrombin injection sites and saline injection sites (right panel); Bars represent the mean of four mice, error bars represent standard deviation (s.d.), * denotes p < 0.05. (For interpretation of the references to color in this figure legend, the reader is referred to the web version of this article.)

