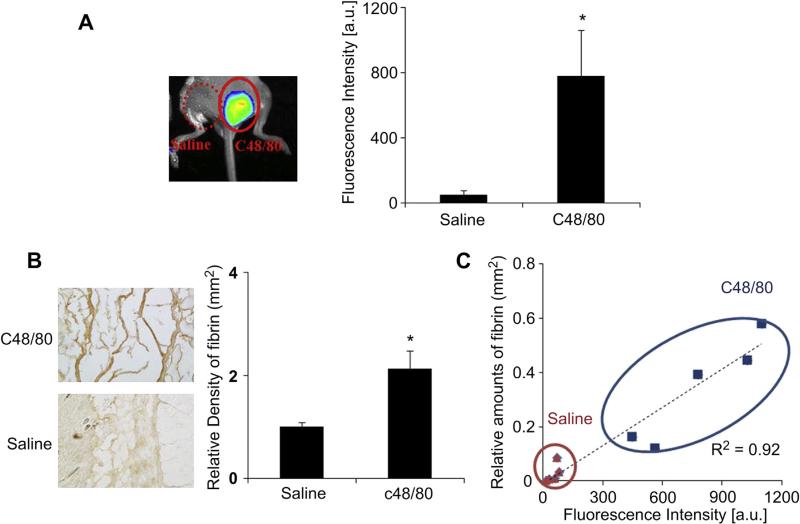
Fig. 4.
To evaluate mast cell activation using fibrin-affinity probe injection, mice were subcutaneously injected with 100 mg of c48/80 or saline as a control. Immediately after injection, probe (60 μL, 0.5 mg/mL) was administered retro-orbital injection. Imaging was captured 4 h after probe administration. Animals were subsequently sacrificed and tissue samples were harvested for histological analysis. (A) Representative in vivo fluorescence imaging (left) and quantitative analysis (right) of the fluorescence intensity at c48/80 and saline control sites. (B) Representative fibrin examination of the tissue surrounding c48/80 and saline control sites. (C) Correlation between relative fibrin accumulation and fibrin-affinity probe associated fluorescent intensities at c48/80 and saline control sites. Four mice were used in the experiments. Error bars represent standard deviation (s.d.), * denotes p < 0.05. (For interpretation of the references to color in this figure legend, the reader is referred to the web version of this article.)

