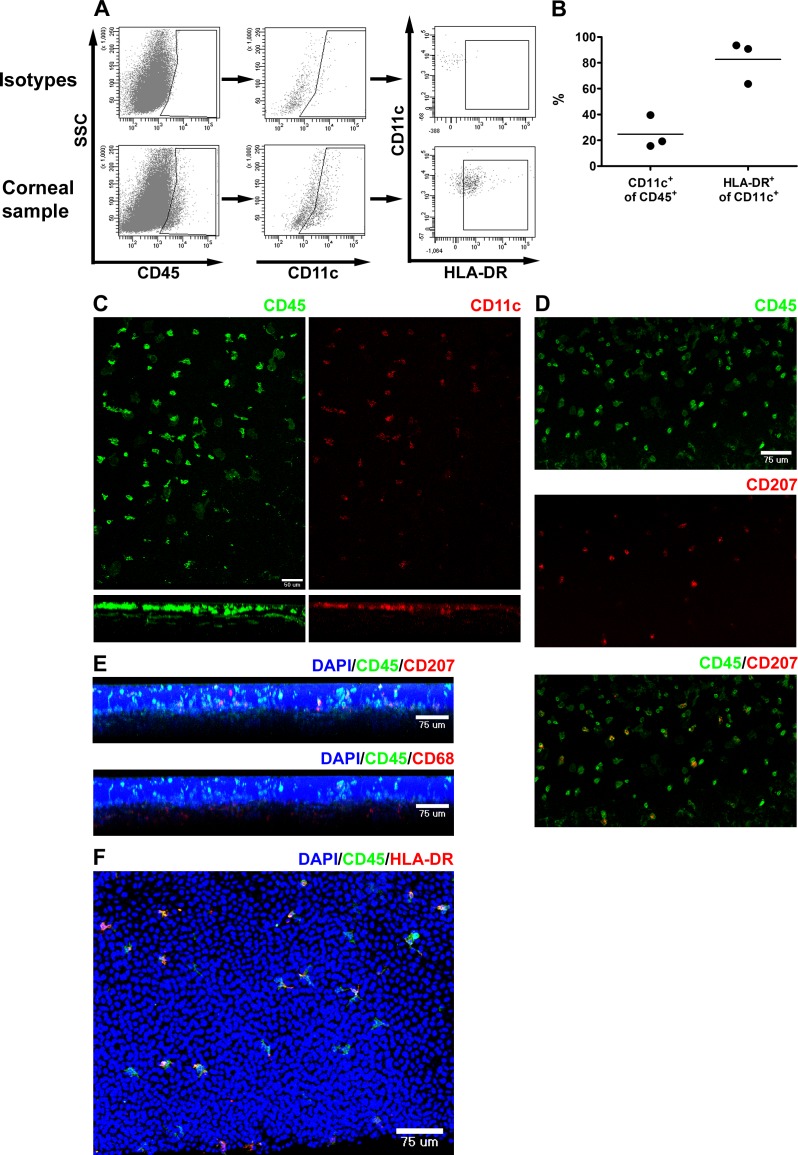
Figure 2.
Phenotype of APC within the normal human cornea. (A, B) Fresh donor human corneal tissue was dispersed with collagenase prior to flow cytometric analysis. (A) Dot plots showing gating strategy to identify CD45+, CD11c+, and HLA-DR+ cells. SSC, side scatter. (B) Graph showing percent of CD45+ leukocytes that are CD11c+ (DC: left) and percent of CD11c+ DCs that are HLA-DR+ (right: n = 3). (C–F) Fresh donor human corneal tissue was fixed, and whole mounts were stained with the indicated markers prior to confocal imaging. (C) Top: Compressed image of z-stack in the xy plane from the peripheral cornea showing staining for CD45 (left: green) and CD11c (right: red). Bottom: Cross-sectional reconstructions in the xz plane (below the corresponding image in xy) were made using microscope automation and image analysis software (Molecular Devices; epithelium toward the top). (D) Compressed image of z-stack in the xy plane from the peripheral cornea showing staining for CD45 (top: green); CD207 (middle: red); and composite (bottom). (E) Cross-sectional reconstructions in the xz plane (epithelium toward the top) showing staining for DAPI, CD45, CD207 (top), and CD68 (bottom). (F) Compressed image of z-stack in the xy plane from the peripheral cornea showing staining for DAPI, CD45, and HLA-DR.

