
Figure 3.
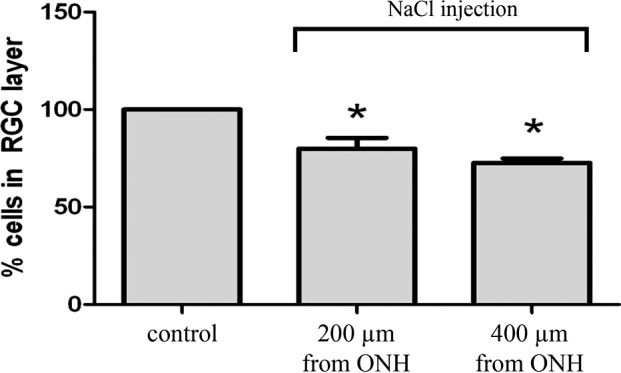
Percent cell loss associated with glaucoma-inducing procedure. This graph depicts the percent survival of cells in the RGC layer at 200 and 4 mm from the ONH 1 month after the episcleral veins were injected with hypertonic saline. Each bar was produced using between 6 and 12 rat eyes. Asterisk represents significance from internal untreated controls. Error bars represent SEM.