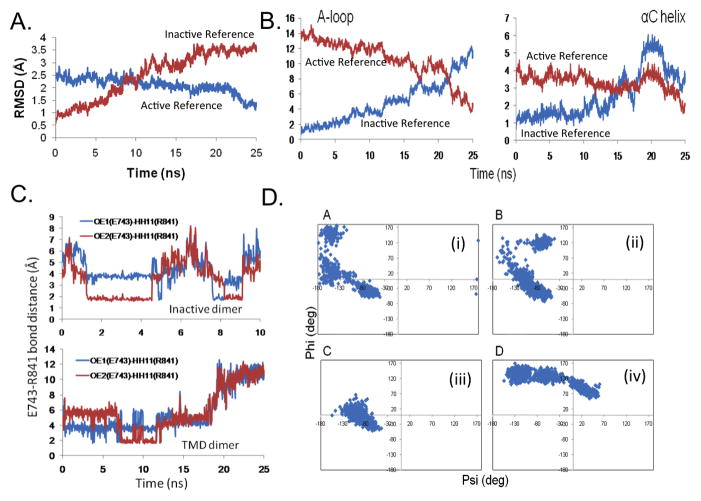
Figure 2.
Transition of the HER4 homodimer system during the TMD simulation. The RMSD is plotted for (A) all backbone atoms of the receiver kinase, and (B) the backbone atoms of the A-loop and αC helix, with respect to the active (target) structure (blue) and with respect to the inactive (starting) structure (red). Results are shown for the simulation in which t=25ns and k=20 kcal/mol/Å2. (C) Bond distance for the E743-R841 salt bridge during the TMD simulation. Top panel displays the bond distance in the inactive dimer (10ns MD control simulation), in which the bond spontaneously breaks and forms during the course of the simulation. Bottom panel displays the bond distance in the 25ns TMD simulation; at t=18ns, the bond breaks. (D) Ramachandran plots for key residues during the 25ns TMD simulation: (i) R841, (ii) L843, (iii) S749, and (iv) F872. Each data point marks a time point in the TMD simulation; this way, any flipping of the dihedral angles can be detected.

