Figure 3.
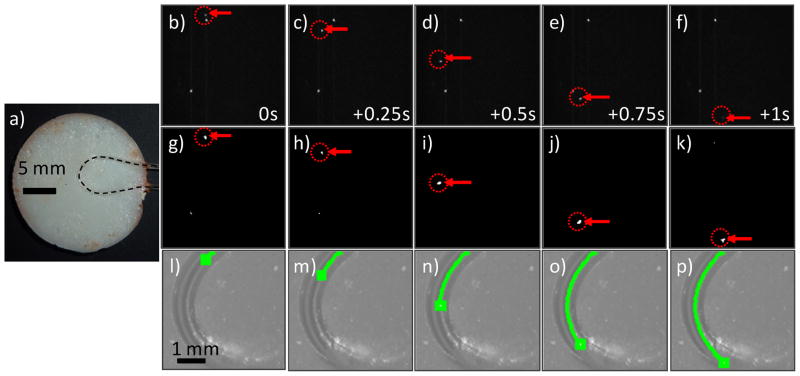
(a) Photograph of an ear-mimicking phantom with curved length of embedded Tygon tubing. The position of the clear tube is indicated with the dotted black line. (b–f) Raw fluorescence image sequence (separated by 0.25 s) showing a fluorescent microsphere (red arrows and dotted circles) flowing in the phantom. The stationary white points were autofluorescent inclusions in the flow tube, simulating stationary tissue autofluorescence observed in vivo. (g–k) the same image sequence is shown after application of Step 1 of the algorithm. (l–p) The CV-IVFC algorithm successfully connected the sphere path in a trajectory over the arc. This trajectory was over-laid on the white light image of the phantom (green line).

