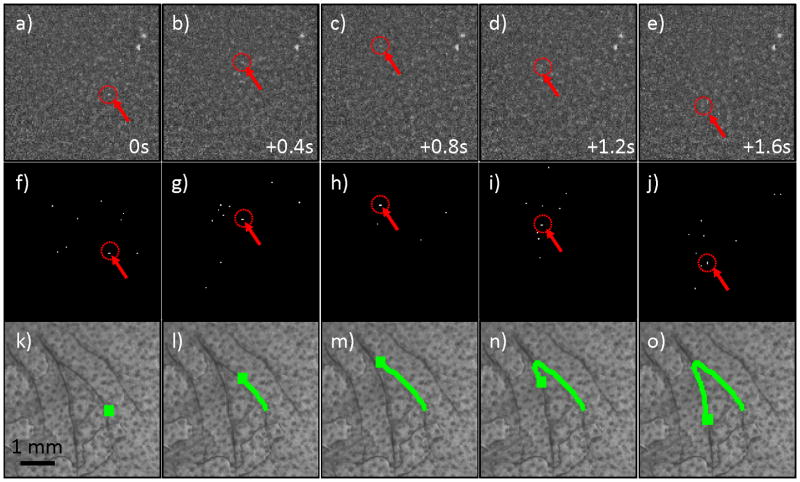
Figure 5.
(a–e) Example fluorescence image sequence of a single MM cell (red arrows and dotted circles) that was observed to rapidly change direction in two blood vessels in the mouse ear. Images shown were separated by 0.4 s. (f–j) Corresponding images sequence after thresholding operation performed in Step 1, and (k-0) the full track of the MM cell that was correctly recovered and over-laid on the white light image of the mouse ear.

