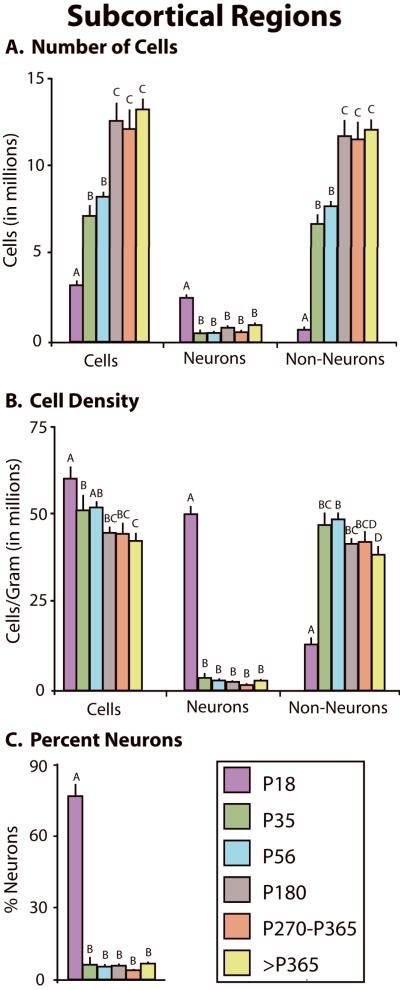
Figure 10.
Changes in cellular composition of subcortical regions. A) Changes in the total number of cells (left), number of neurons (center), and number of non-neurons (right) in the neocortex at different developmental stages. The total number of cells and non-neurons increased across development, but the number of neurons was highest at P18, decreased by P35 and remained unchanged across development. B) Changes in the total cell density (left), neuronal density (center), and non-neuronal density (right) across development. The total cell density and neuronal density was highest at P18. While the total cell density gradually decreased across development, neuronal density decreased dramatically by P35 and thereafter remained constant. In contrast, non-neuronal density was lowest at P18, increased by P35, then decreased slightly throughout adulthood. C) The percentage of neurons was highest at P18, significantly decreased by P35, and remained constant across development. Mean + s.e. Values with different letters are significantly different.

