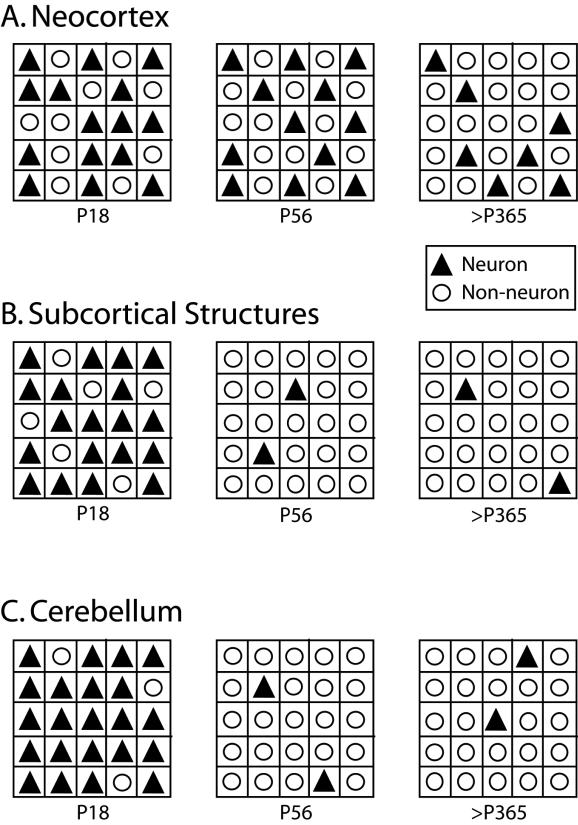
Figure 12.
Schematic of changes in cellular composition across development. The major assumption here is that cells (neuronal and non-neuronal) occupy the entire structure and that cell size does not change dramatically. This assumption is purposely simplified to better appreciate changes in number and density of cells across development. Each outer square represents a set volume of tissue for each age group. Neurons are represented by black triangles and non-neurons are represented by white circles. The ratio of neurons to non-neurons follows a distinct developmental trajectory in each brain region. A) In the neocortex, the total number of cells increases with the overall size of the structure. However, the number of neurons remains constant from P18 through adulthood. Thus, as the size of the structure increases the neuronal density decreases. B) In the subcortical structures, the total number of cells is lowest at P18 while the total number of neurons is highest at that age, resulting in a high neuronal density. Throughout development, the number of neurons decreases as the total number of cells increases, resulting in a significantly lowered neuronal density. C) In the cerebellum, the total number of cells are lowest at P18, but because a large proportion of those cells are neuronal we see a very high neuronal density. The number of neurons remains constant throughout development into adulthood while the number of cells (non-neurons) increase resulting in a lower neuronal density. All schematics are based on the total cell density and neuronal density of brain regions at P18, P56, and <P365.

