
Fig. 4.
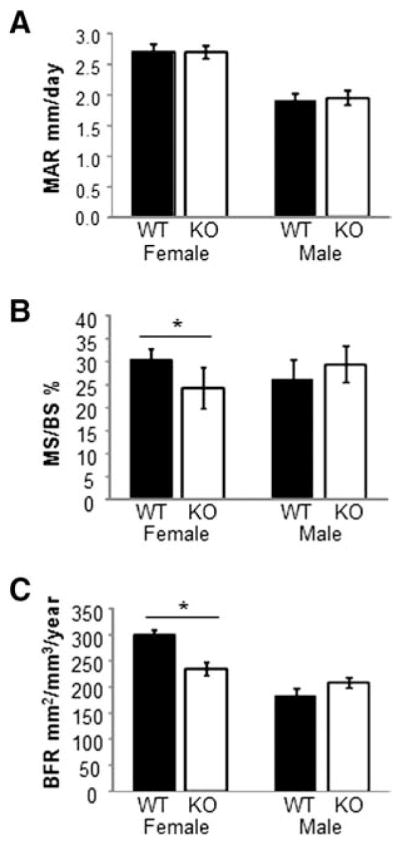
Dynamic bone parameters. (A–C) Calcein-labeled femurs from WT and Kal-KO mice were used to calculate the mineral apposition rate (MAR), mineralizing surface per bone surface (MS/BS) and the bone formation rate (BFR). Graphs shown are mean ± SEM as follows for female mice (n = 10 WT, n = 7 KO) and male mice (n = 12 WT, n = 13 KO).