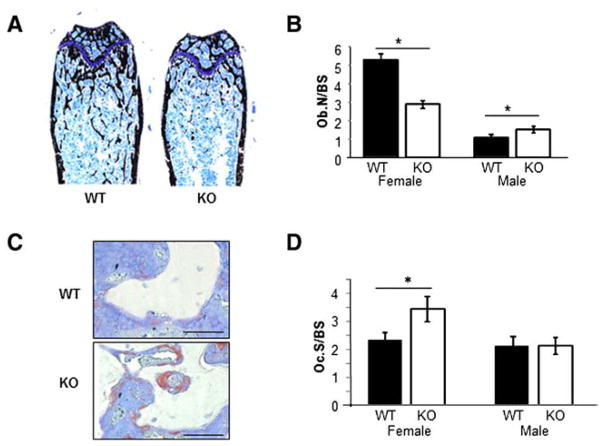
Fig. 5.
Histological analysis of femoral bone. (A) Representative montaged images of histological sections taken from the distal femur of WT and Kal-KO mice labeled with von Kossa and McNeal tetrachrome stains. 10× magnification. (B) The number of osteoblasts associated with trabecular surfaces was quantified and normalized to bone surface (Ob.N/BS). Results represent 3 serial sections per bone (females, n = 3; males, n = 4–5 mice per genotype). (C) Tissue sections from WT and Kal-KO femurs were stained for TRAP and counter stained with toluidine blue. TRAP-positive osteoclasts appear purple in color. Scale bar is 50 μm. (D) The area of TRAP-positive osteoclasts per bone surface (Oc.S/BS) was quantified on 3 serial sections per bone, which revealed an increase in Oc.S/BS in female Kal-KO mice (n = 6 mice per genotype), but not in male Kal-KO mice (n = 8 mice per genotype), when compared to sex-matched WT mice.

